
T-shirt sizing in Agile is a relative estimation technique. Instead of guessing hours, the team gives each epic, feature or task a size from XS to XXL based on how big it is compared with the other work in the backlog. It is the fastest way for a project manager or product owner to see the shape of a large backlog, prepare for portfolio planning, or answer the classic stakeholder question, “Roughly how big is this project?”, without pretending to know more than the team does.
Sizes are relative, not hours. XS to XXL compares backlog items with each other, which makes T-shirt sizing ideal for epics, roadmaps and early project planning.
Pick the method that fits the job. Use planning poker for a few items that need discussion, an affinity sort for big backlogs (about 60 items an hour versus 20), and sprint buckets to turn sizes into a forecast.
Split anything bigger than L. An epic that needs more than six sprints is too uncertain to plan. Break it down before the project team commits to it.
Share a range, not a promise. Give stakeholders a low and a high number of sprints, then switch to story points as work gets close to a sprint.
This guide walks project managers through the three T-shirt sizing methods that work best in practice: T-shirt planning poker, affinity sizing and sprint bucket mapping. You will see when to use each one, how to run it step by step, a worked project example, and a free T-Shirt Sizing Board that turns your sizes into a sprint forecast you can share.
What Is T-Shirt Sizing in Agile?
T-shirt sizing replaces numbers with labels everyone already understands: XS, S, M, L, XL and sometimes XXL. A team looks at a backlog item and asks one question: is this bigger or smaller than the items we already sized? Because nobody has to commit to a number of hours, the conversation stays on scope, complexity and risk, which is exactly what a project manager needs to understand early in a project.
The technique is relative, just like story points. Story points are often described as an absolute or numeric method, but they are also relative sizes that each team calibrates for itself; the numbers simply make them easier to add up. T-shirt sizes trade that arithmetic for speed, which is why teams use them for epics and roadmaps and switch to points when the work gets close to a sprint.
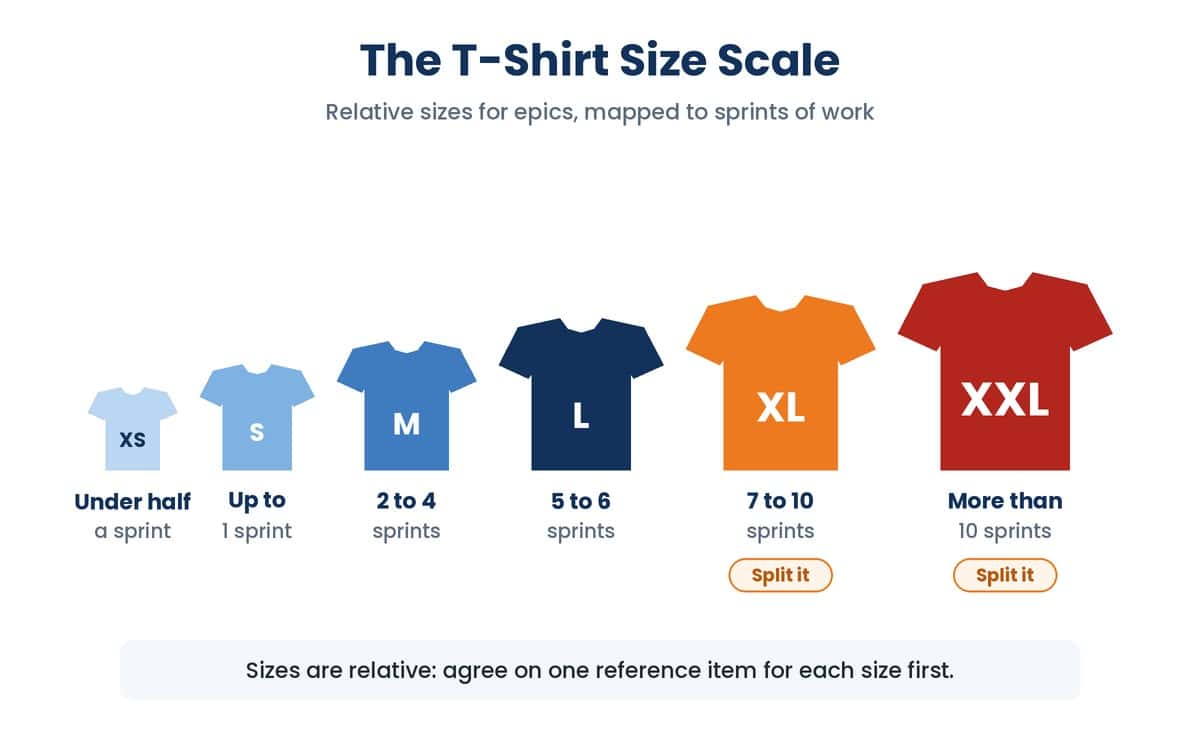
To make the sizes useful, give each one a meaning your project team agrees on. Software development teams use T-shirt sizing most, but it works for any project team, from marketing campaigns to office moves. Here is a starting scale for epics in two-week sprints:
T-Shirt Size Scale for Epics
Agree on one real reference item for each size, then adjust the sprint ranges to your team.
| Size | Relative effort | Sprints of work | Example epic |
|---|---|---|---|
| XS | A quick change with no unknowns | Under half a sprint | Change the wording on a sign-up email |
| S | Small and well understood | Up to 1 sprint | Forgot password flow |
| M | Several stories, few unknowns | 2 to 4 sprints | User registration with email checks |
| L | Large, touches several parts of the product | 5 to 6 sprints | Reporting dashboard with exports |
| XL | Too big to plan with confidence | 7 to 10 sprints | Document library with search and permissions |
| XXL | A project in its own right | More than 10 sprints | Replace the whole customer portal |
When Should Project Managers Use T-Shirt Sizing?
T-shirt sizing shines whenever you need a quick, shared view of how much work is ahead and you do not yet have the detail for story points. The most common moments are:
- Project kick-off. Size the epics to see how much work is involved and whether the Agile team has the right people, especially when you are collaborating with a software development partner.
- Agile portfolio and roadmap planning. Compare upcoming features across teams without breaking every one of them down into stories.
- Backlog triage. Spot the few huge items hiding in a long product backlog so the product owner can split, reorder or drop them.
- Teams new to estimation. Sizes are easy to learn and give a team a gentle first step before story points.
Be honest with stakeholders about what the sizes mean. Some Agile practitioners argue that estimates add little value and that a team should simply work on the most valuable item next, an idea known as #NoEstimates. Project managers rarely have that luxury, because budgets, contracts and release dates still need a forecast. T-shirt sizing is a good compromise: it gives management a rough picture for capacity planning without turning a guess into a project schedule, which is the most common mistake organizations make with early estimates.
The main premise of the no estimates movement is that estimates do not directly add value to your process or work, so you should find ways to reduce the estimation process or even stop it if possible
Stop Estimating: The #NoEstimates Movement in Agile – DZone Agile
The same idea of relative, size-based thinking applies outside software too. For teams that want to create branded apparel for events or team-building activities, exploring options to start private label production can help them develop custom designs that reflect their brand identity, and the project behind it can be sized just like any other backlog.
Method 1: T-Shirt Planning Poker
Planning poker is the best-known Agile estimation game, and it works just as well with T-shirt sizes as with numbers. James Grenning first described the method in 2002 and Mike Cohn later made it popular. Each estimator holds a set of size cards and everyone reveals their choice at the same time, so the first person to speak cannot anchor the rest of the team. Use it when you have a small number of important items that deserve a real conversation.
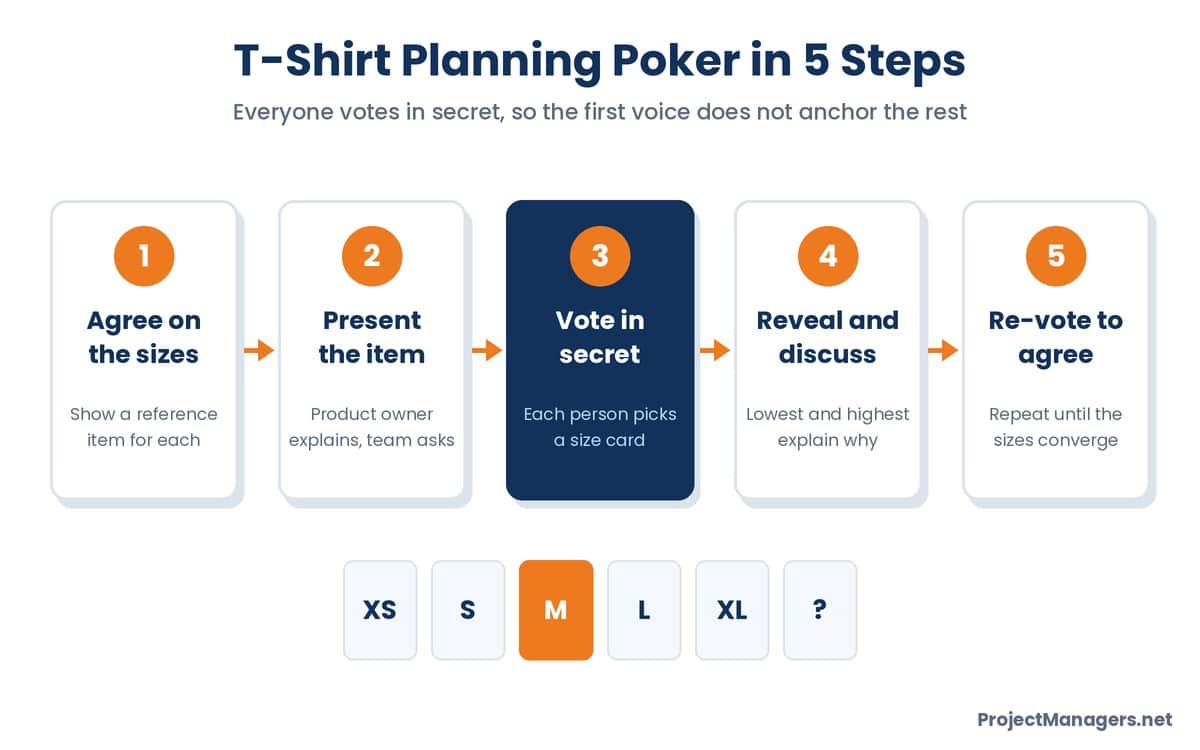
To facilitate a planning poker T-shirt sizing session, follow these steps:
- Agree on the sizes. The facilitator or project manager hands out the cards (XS, S, M, L, XL and a ? card) and shows one reference item for each size.
- Present the item. The product owner explains the epic or feature, using an Agile charter, a business case or simply the epic description. The team asks questions.
- Vote in secret. Each team member picks the card that matches their estimate and keeps it face down.
- Reveal and discuss. Everyone turns their card over at once. If the sizes differ, the people with the smallest and largest cards explain their thinking.
- Re-vote until you agree. Repeat the vote until the team settles on a size everyone can accept. If the team cannot agree after two or three rounds, the item probably needs to be split or researched first.
Planning poker needs the whole team, which makes it slower than the other methods, but the discussion is the point. When two developers pick XS and XL for the same item, they almost always have different assumptions about the scope, and surfacing that early saves the project from a nasty surprise later.
Research example
A random number changed people’s estimates by 20 points
In a classic experiment, Amos Tversky and Daniel Kahneman spun a wheel that stopped on 10 or 65, then asked people to estimate the share of African countries in the United Nations. Those who saw 10 guessed 25% on average; those who saw 65 guessed 45%. In a sizing session, the first size spoken aloud works the same way, which is why planning poker cards are revealed at the same time.
Source: Anchoring effect, summary of Tversky and Kahneman (1974)
By the numbers
- 25% vs 45%
average estimates after seeing a low or a high anchor
- 2002
year James Grenning first defined planning poker
- All at once
cards are revealed together so no single voice sets the size
Method 2: Affinity Sizing (The Silent Wall Sort)
Affinity sizing is the method to use when a project manager or product owner brings a long backlog and needs rough sizes fast. Instead of discussing each item, the team groups items of similar size on a wall or an online whiteboard, mostly in silence. It is especially useful at the start of a project, after a story-writing workshop, or when a backlog has grown out of control.
Here is how to run it:
- Set up the columns. Write XS, S, M, L and XL across the top of a wall or a digital board, and add a column called Discuss.
- Put each backlog item on a card. A short title is enough. The product owner stays nearby to answer quick questions.
- Place once. One team member reads an item and places it under the size they think fits, without talking.
- Move once. Anyone who disagrees can move the card to another column, again without talking.
- Moved again? Discuss it. If someone wants to move a card a second time, it goes to the Discuss column instead. At the end, size those items with planning poker.
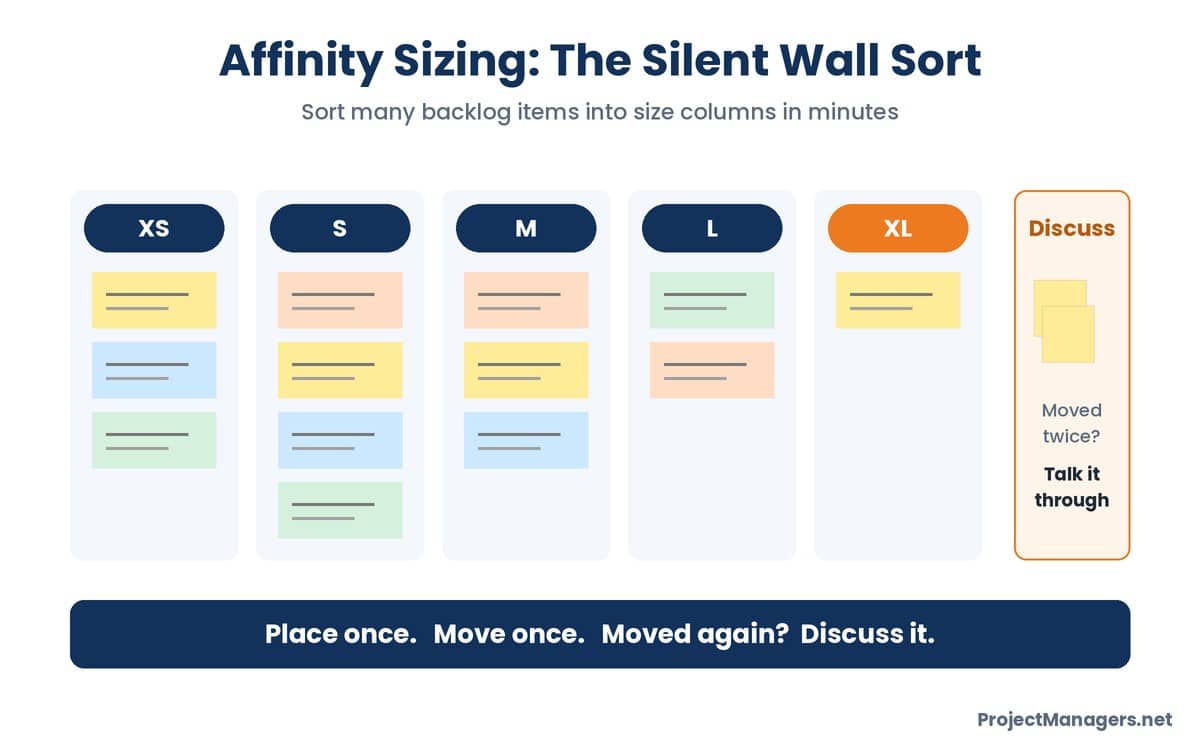
The no-talking rule is what makes the method fast, and it also stops one confident person from shaping every estimate. The team must move quickly and not overthink. The cards that end up in the Discuss column are not a failure; they are exactly the items where the project team has different assumptions or hidden risk.
Expert guidance
Affinity sizing can be three times faster than planning poker
Mountain Goat Software, the company founded by Agile estimation author Mike Cohn, reports that teams typically size around 60 backlog items an hour with affinity estimation and sometimes more than 100, while a reasonable target for planning poker is about 20 items an hour. Its recommended pattern matches this guide: sort the easy items fast, then use planning poker on the items that would not settle.
In their words
“Affinity estimation is not a way to avoid thinking.”
Mountain Goat Software, Affinity Estimation guide (source)
By the numbers
- About 60
backlog items sized per hour with affinity estimation
- 100+
items an hour that some teams reach
- About 20
items per hour as a planning poker target
Method 3: Sprint Bucket Mapping for Epics
The third method turns sizes into something a sponsor can plan around. Epics are large pieces of value that will later be broken down into user stories, and analyzing an epic should always start with its Minimum Viable Product (MVP), the smallest version that delivers value. Early on there is little data, so the team sizes each epic and maps every size to a range of sprints. The estimate is refined as the MVP is built.
Use a sprint chart like this one, adjusted to your own team and sprint length:
Sprints to Epic Estimating Chart
One team, two-week sprints. The same chart works for one-month sprints because it counts sprints, not weeks.
| Size | Sprints | What to do |
|---|---|---|
| S | 1 sprint | Plan it into the next suitable sprint. |
| M | 2 to 4 sprints | Break it into user stories during refinement. |
| L | 5 to 6 sprints | Confirm the MVP and look for a smaller first release. |
| XL | 7 or more sprints | Split it before the team commits. It is too uncertain to plan. |
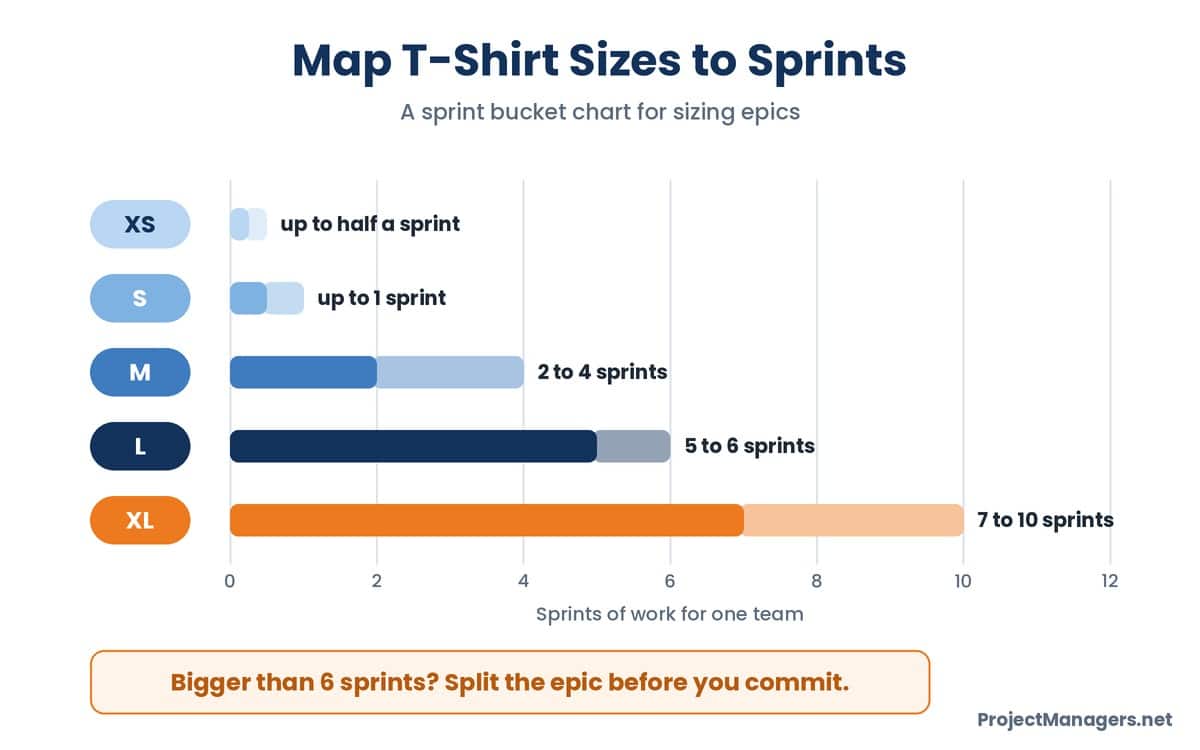
Working in XL sizes is not ideal. If an epic is larger than six sprints, break it down. Once every epic has a size, add up the low and high ends of each range and divide by the number of teams to get a forecast: “between 6 and 13 sprints, and we plan to 10.” That range is far more honest than a single date, and it narrows as each epic is refined.
Real-life example
Basecamp sizes projects into two buckets instead of estimating them
In its Shape Up method, Basecamp sets an “appetite” for each project rather than an estimate. A small batch is work that one designer and one or two programmers can build in one or two weeks; a big batch takes the same team a full six-week cycle. When an idea will not fit in six weeks, the team narrows the problem or splits off a part that does fit, the same rule this method applies to XL epics.
In their words
“An appetite is completely different from an estimate.”
Ryan Singer, Shape Up, Basecamp (source)
By the numbers
Which T-Shirt Sizing Method Should You Use?
Most project teams end up using all three methods at different stages. This comparison helps you choose:
Compare the 3 Methods
| Method | Best for | Speed | Watch out for |
|---|---|---|---|
| Planning poker | A few important or risky items that need discussion | About 20 items an hour | Long debates; split items the team cannot agree on |
| Affinity sizing | Large backlogs at kick-off or after a workshop | About 60 items an hour | Too much talking; no baseline items |
| Sprint bucket mapping | Turning epic sizes into a release forecast | Minutes once items are sized | Treating the range as a fixed date |
Speeds: Mountain Goat Software.
T-Shirt Sizing Board: Turn Sizes Into a Forecast
Use this free T-Shirt Sizing Board to put sprint bucket mapping into practice. List your epics or features, pick a size and a confidence level for each one, and the board adds up the sprint ranges, shows where the effort sits, flags items that need splitting and gives you a forecast with dates. It opens with the supervisor portal example below already loaded, and you can edit the size scale to match your team.
Your size scale (sprints per size, edit to match your team)
Defaults follow the sprint chart in this article. Change the low and high number of sprints for each size if your team uses a different scale.
Add each epic or feature and pick a T-shirt size. Lower the confidence when the team is unsure; it widens the range.
| Epic or feature | Size | Confidence | Sprints |
|---|
Add at least one sized item to see a forecast.
- Items sized0epics and features
- Total effort0team sprints, low to high
- Plan to0calendar sprints
- Finish between–based on your start date
Where the effort sits
Each item uses the low and high sprints of its size. Medium confidence adds 25% to the high number and low confidence adds 50%. “Plan to” sits 60% of the way from low to high, and teams in parallel are assumed to share the work evenly. Everything runs in your browser; nothing is sent or saved.
T-Shirt Sizing Agile Example
Imagine your project team is building a website where an organization’s supervisors can sign in and manage their documentation. Center the sizing on the project goals: the first release must let supervisors register, sign in and find documents. Each epic below will later be broken down into user stories; for now, the team sizes them with an affinity sort and maps them to sprints.
Supervisor Portal: Epics and Sizes
Two teams, two-week sprints. These are the same items loaded in the T-Shirt Sizing Board above.
| Epic | T-shirt size | Sprints | Notes |
|---|---|---|---|
| User registration | M | 2 to 4 | Email checks and approval by an administrator. |
| Login and single sign-on | M | 2 to 5 | Medium confidence: depends on the company identity provider. |
| User profile | S | 0.5 to 1 | Name, role, photo and notification settings. |
| Forgot password | XS | 0.25 to 0.5 | Standard reset flow. |
| Document library with search | XL | 7 to 15 | Low confidence and too big: split into upload, browse and search before planning. |
| Notifications | S | 0.5 to 1.25 | Email alerts when a document changes. |
With two teams, the backlog comes to roughly 6 to 13 sprints, and the project manager plans to about 10. More than half of that effort sits in the document library, so the first action is obvious: split the XL epic and run a short technical spike on search before anyone promises a date.
Benefits and Pitfalls of T-Shirt Sizing
T-shirt sizing is popular because it simplifies estimation. Team members spend less time debating hours and more time talking about scope and risk, and when the sizes live in a shared tool, everyone can see who is working on what and how much is on each person’s plate. The main benefits for project managers are:
- Speed. A team can size dozens of items in a single session.
- Easy to learn. Anyone, including stakeholders outside the project team, understands the difference between S and XL.
- Better conversations. Disagreement on a size exposes hidden assumptions early in the project.
- Capacity planning. Mapped to sprints, sizes give a first forecast for budgets and roadmaps.
The pitfalls are just as real, and each has a simple fix:
- Subjectivity. One person’s M is another person’s L. Agree on a reference item for each size.
- Unclear differences between sizes. Use fewer sizes. Start with S, M, L and XL and add XS or XXL only if you need them.
- Sizes you cannot add up. T-shirt sizes are labels, not numbers. Map them to sprint ranges or story points before you forecast.
- Estimates treated as commitments. Always share a range and refine it as the work is broken down.
To see T-shirt sizing in action, watch the video below. It walks through a T-shirt sizing estimation session, shows how planning poker fits into the process, and explains how teams use relative sizing to estimate work more efficiently.
Video: T-Shirt Sizing Estimation, Agile Estimation Techniques (JOGO Agile Coaching, 10 minutes). Watch it on YouTube.
Tools for T-Shirt Sizing Online
Sizes are most useful when the whole project team can see them in one place. Most work management tools can store a T-shirt size as a custom field, and many online whiteboards are ideal for affinity sorting. For teams looking to visually represent their T-shirt sizing estimates or create custom T-shirts for team-building events, consider T-shirt printing online services to easily design and order custom apparel. Two popular tools for T-shirt sizing are Asana and Trello.
Asana
Asana uses T-shirt sizing for its own content projects and recommends deciding on a small set of sizes, agreeing on what each one means and tracking them in a shared field so project managers can gauge each person’s workload. Its guide also compares T-shirt sizing with story points.
How to use T-Shirt Sizing to Estimate Projects • Asana
Trello
Trello lets you add a custom field for T-shirt sizes to every card, then sort and filter cards by size. Automation rules can keep cards organized in the order you want, and because boards are shared, the whole project team sees the same picture.
How T-Shirts Can Style Up The Strategy For Your Next Big Project Kickoff (trello.com)
T-Shirt Sizing vs Story Points and Other Alternatives
T-shirt sizing is not the only way to estimate in Agile. The two alternatives project managers meet most often are story points and plain time estimates. Many teams combine them: T-shirt sizes for epics and roadmaps, story points for the stories in the next few sprints.
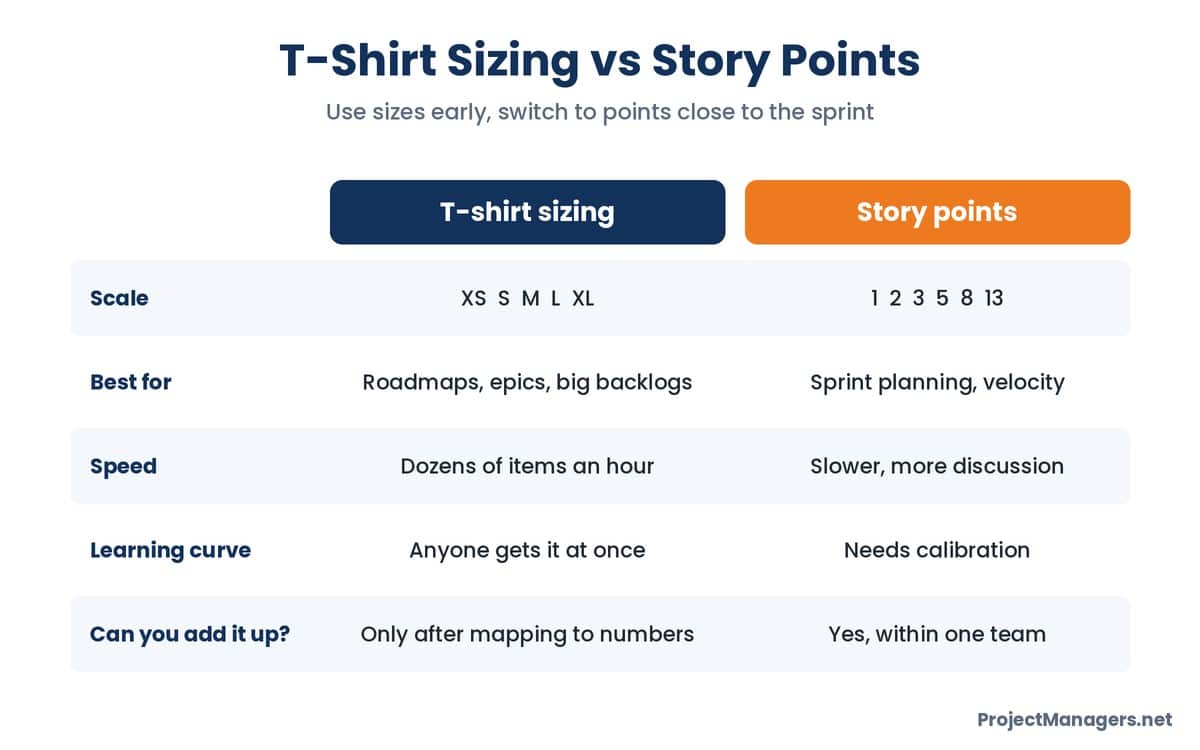
Fibonacci Series and Story Points
Story points represent the size, difficulty and effort of a user story compared with other stories. Many teams use a Fibonacci-style scale (1, 2, 3, 5, 8, 13, 21), where each number is the sum of the two before it. The scale is deliberately non-linear: the gaps grow as items get bigger, because the bigger an item is, the less precisely anyone can estimate it. Story points can be added up, which lets a team track its velocity from sprint to sprint.
Story points are not as precise as they look. Ron Jeffries, one of the creators of Extreme Programming, explains that stories were first estimated in “ideal days” and only later renamed to points, and he now questions how teams use them.
I like to say that I may have invented story points, and if I did, I’m sorry now.
Ron Jeffries, Story Points Revisited
Converting T-Shirt Sizes to Story Points
When work gets close to a sprint, many teams translate sizes into points. A common starting mapping is XS = 1, S = 2, M = 3 or 5, L = 8 and XL = 13, but there is no standard: each team should calibrate the mapping against items it has already delivered. Anything that maps above 13 points is usually an epic that needs to be broken down, not a story to estimate.
If you need a single early number for a whole project rather than relative sizes, a SWAG estimate or a top-down analogous estimate may suit you better. For tasks where you can give an optimistic, a most likely and a pessimistic time, use the PERT formula and calculator.
T-Shirt Sizing Facts Worth Checking
Ten common claims about T-shirt sizing and Agile estimation, checked against the Scrum Guide, research and primary sources.
| # | You may hear | What the sources say | Source |
|---|---|---|---|
| 1 | The Scrum Guide tells teams to use T-shirt sizes or story points. | The Scrum Guide prescribes no estimation technique. It says backlog items are refined to add details such as size, and leaves the method to the team. | The Scrum Guide 2020 |
| 2 | The product owner should assign the sizes. | The Scrum Guide says the Developers who will do the work are responsible for sizing; the product owner helps them understand trade-offs. | The Scrum Guide 2020 |
| 3 | Story points are an absolute estimate, unlike T-shirt sizes. | Both are relative. Story points compare items with each other and each team calibrates its own scale against baseline items. | Mountain Goat Software |
| 4 | The Fibonacci scale is linear. | It is non-linear on purpose. The gaps between values grow so the scale reflects the extra uncertainty in bigger items. | Planning poker (Wikipedia) |
| 5 | Mike Cohn invented planning poker. | James Grenning first defined and named planning poker in 2002. Mike Cohn later popularized it in Agile Estimating and Planning. | Planning poker (Wikipedia) |
| 6 | Saying your size out loud first does no harm. | Anchors move estimates. People who first saw 10 or 65 estimated 25% and 45% for the same question, which is why poker cards are revealed together. | Tversky and Kahneman, 1974 |
| 7 | Planning poker is the fastest way to size a backlog. | Affinity estimation typically sizes about 60 items an hour, compared with about 20 for planning poker. | Mountain Goat Software |
| 8 | A Medium means the same thing on every team. | Sizes only work once a team agrees what each one represents, using common examples of its own work. | Asana |
| 9 | Story points were always meant to measure complexity, never time. | In Extreme Programming, stories were first estimated in time, then in “ideal days”, which were later renamed points. | Ron Jeffries, Story Points Revisited |
| 10 | A huge item is fine as long as it is estimated. | Basecamp narrows or splits any project that will not fit in a six-week cycle rather than estimating it, the same logic as splitting XL epics. | Basecamp, Shape Up |
Sources checked November 5, 2026.
T-Shirt Sizing FAQ
Frequently Asked Questions
What is T-shirt sizing in Agile?
T-shirt sizing is a relative estimation technique where a team labels backlog items XS, S, M, L, XL or XXL based on how big they are compared with each other. It is used for epics, roadmaps and large backlogs when there is not yet enough detail for story points.
What are the 3 T-shirt sizing methods?
T-shirt planning poker, where everyone reveals a size card at the same time; affinity sizing, where the team silently sorts many items into size columns; and sprint bucket mapping, where each size is mapped to a range of sprints to build a forecast.
How do you convert T-shirt sizes to story points?
A common starting point is XS = 1, S = 2, M = 3 or 5, L = 8 and XL = 13, but there is no standard. Calibrate the mapping against items your team has already delivered, and split anything above 13 points.
Who should assign T-shirt sizes?
The people who will do the work. The Scrum Guide makes the Developers responsible for sizing, while the product owner explains the items and the project manager or Scrum Master facilitates.
How many T-shirt sizes should a team use?
Start with four: S, M, L and XL. Add XS and XXL only if your work varies a lot in size. Fewer sizes make the differences clearer and the sessions faster.
How long should a T-shirt sizing session take?
For a backlog of 30 to 60 items, plan about an hour with affinity sizing, then extra time for planning poker on the items that went to the Discuss column.
Conclusion
T-shirt sizing remains one of the simplest and most effective ways for Agile teams and project managers to estimate work without getting bogged down in false precision. Use planning poker when a few items need a real conversation, an affinity sort when you face a long backlog, and sprint bucket mapping when stakeholders need a forecast. Whichever method you choose, agree on what each size means, split anything bigger than L, and share a range rather than a single date.
As the project moves forward, refine the sizes into story points and track how long the work really takes, so your next round of T-shirt sizing is even better calibrated. Try the T-Shirt Sizing Board above with your own backlog, and explore more free calculators and templates in our Free Project Management Toolkit. Ultimately, the goal is progress, not perfection.
Suggested articles:
- SWAG Estimates in Project Management
- Why You Need to Use Top-Down Analogous Estimating
- Agile Scrum for Beginners Made Easy: Roles, Practices and Ceremonies

Shane Drumm, holding certifications in PMP®, PMI-ACP®, CSM, and LPM, is the author behind numerous articles featured here. Hailing from County Cork, Ireland, his expertise lies in implementing Agile methodologies with geographically dispersed teams for software development projects. In his leisure, he dedicates time to web development and Ironman triathlon training. Find out more about Shane on shanedrumm.com and please reach out and connect with Shane on LinkedIn.