
Every team drowning in logs, metrics, and dashboards eventually faces the same question: Kibana or Grafana? Both platforms turn raw operational data into readable visuals, yet they solve different problems. Kibana lives inside the Elastic Stack and excels at log search, while Grafana pulls data from dozens of sources to unify monitoring across an entire environment.
But choosing a tool is only part of the battle. Before dashboards can help, data has to be gathered, cleaned, modeled, and routed correctly, especially in organizations where telemetry arrives from many systems at once. That’s why many teams rely on professional data management services, such as those offered by SoftTeco, to ensure the data feeding their observability stack is accurate, usable, and consistent enough to power reliable insights.
Picking the wrong tool can mean months of dashboard rebuilding, retraining, and frustrated engineers who lose confidence in the new system. This guide breaks down how each platform handles data integration, querying, alerting, and visualization so you can match the right tool to your existing infrastructure and team skills. Here is how each platform approaches the core job of turning raw data into decisions.
Kibana
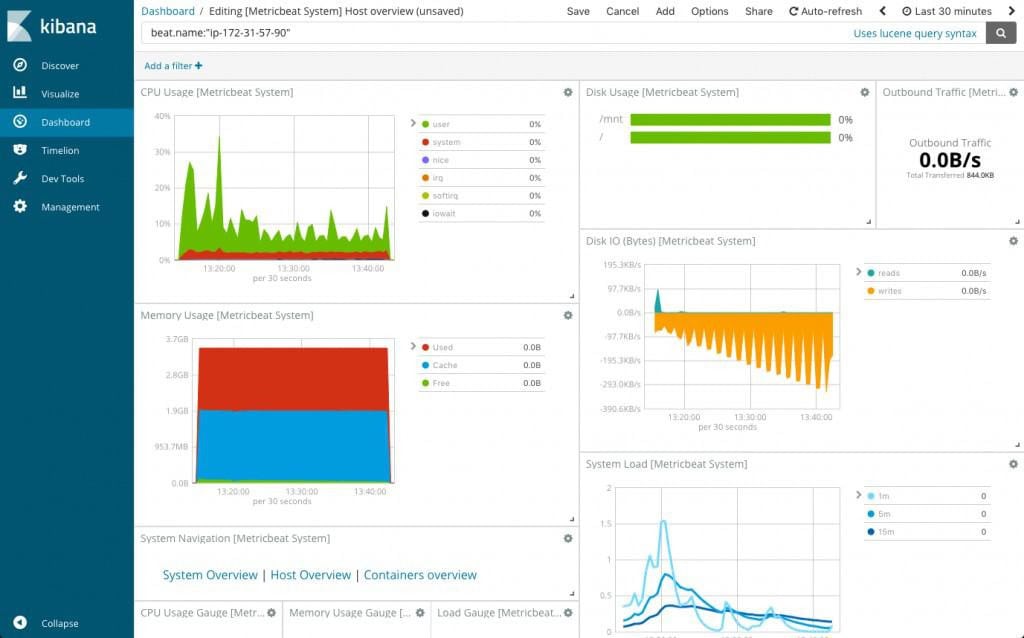
Kibana is an open-source tool for visualizing and exploring data, built primarily for log and time series analysis. Elastic launched Kibana in 2013 as the visualization layer of the Elastic Stack, working alongside Elasticsearch and Logstash. It gives users search and visualization capabilities directly on Elasticsearch data, enabling dynamic dashboards, graphs, and shareable reports across technical and business teams.
What Kibana Is Used For
Beyond general dashboards, Kibana supports several specialized workflows that extend its core value. Here are the primary use cases teams rely on most:
- Log Analysis: Kibana filters, searches, and visualizes log data at scale, making it easier to spot recurring patterns and troubleshoot production issues before they escalate into outages.
- Geospatial Analysis: The platform includes mapping tools that plot location-based data directly onto interactive maps, helping teams analyze geographic trends without exporting data to a separate GIS tool.
- Alerting: Kibana now ships native alerting rules alongside the older Watcher feature, letting users trigger notifications when data crosses defined thresholds or patterns.
- Application Performance Monitoring: Kibana surfaces detailed performance metrics that help engineering teams identify bottlenecks, slow transactions, and dependency failures across distributed applications.
- Anomaly Detection: Built-in machine learning models data behavior automatically, flagging deviations and reducing false positives so analysts spend less time chasing noise.
Advantages of Kibana
Kibana’s tightest advantage is how deeply it integrates with the rest of the Elastic ecosystem. These are the benefits that consistently draw teams to the platform:
- Elasticsearch Integration: Kibana was purpose-built to work with Elasticsearch, giving organizations already invested in the Elastic Stack a native, friction-free visualization layer.
- Open Source Foundation: Kibana remains free to self-host, backed by a large contributor community that maintains documentation, plugins, and ongoing feature development.
- Real-Time Monitoring: Teams can track events as they happen, which shortens response times and helps resolve incidents before they affect end users.
- Rich Visualization Options: The platform offers line charts, bar charts, heat maps, and geographic visualizations, alongside Lens for drag-and-drop chart building and Canvas for presentation-style dashboards.
- Customizable Dashboards: Users can build personalized dashboards and reports tailored to specific teams, from security operations to executive reporting views.
Drawbacks of Kibana
No platform is without trade-offs, and Kibana’s limitations mostly stem from its tight coupling to Elasticsearch. Consider these constraints before committing to the platform:
- Limited Data Source Support: Kibana works natively only with Elasticsearch, so any data from other databases must first be ingested through Beats or Logstash before it becomes visible.
- Performance at Scale: Poorly architected deployments can slow considerably when working with large datasets, making index design and cluster sizing critical from the start.
- Learning Curve: New users often need time to understand Kibana’s full feature set, particularly around index patterns and saved search configurations.
- Complex Queries: Writing advanced queries typically requires familiarity with Elasticsearch Query DSL, which can challenge users without a technical background.
Grafana
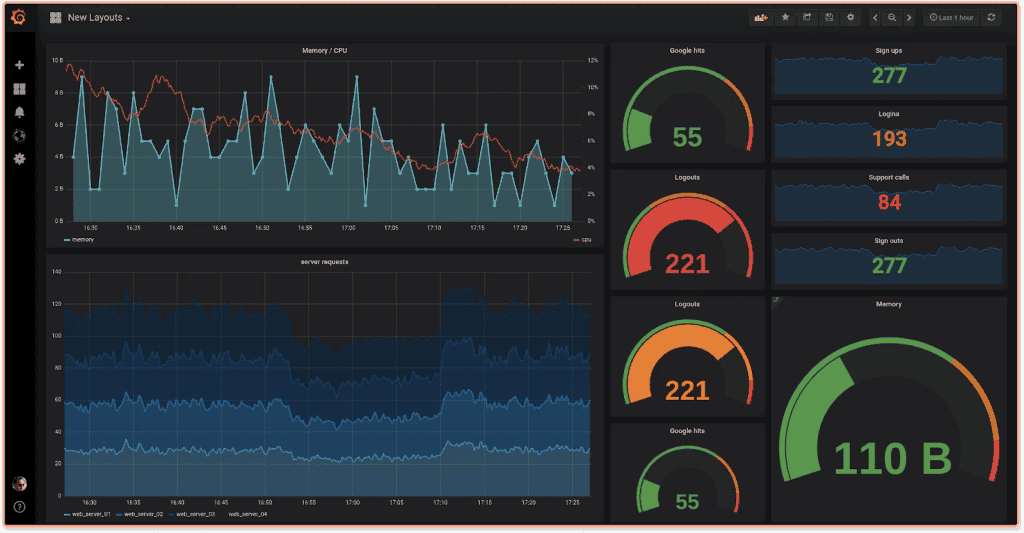
Grafana is an open-source monitoring, visualization, and metrics analysis platform released in 2014. It has since become one of the most widely adopted observability tools across industries, prized for connecting to nearly any backend. Unlike Kibana, Grafana was built data source agnostic, supporting Elasticsearch, Prometheus, Graphite, InfluxDB, and dozens of others through native integrations and community plugins.
What Grafana Is Used For
Grafana’s flexibility means it shows up across a wide range of monitoring and DevOps workflows. The following use cases represent where it delivers the most value:
- Monitoring: Grafana tracks the performance and health of systems, applications, and infrastructure by pulling data from databases, APIs, and dedicated monitoring tools into one view.
- Visualization: The platform excels at rendering time series data as graphs, charts, and tables, helping teams spot trends, patterns, and anomalies that drive faster decisions.
- DevOps and CI/CD: Grafana is a common fixture in deployment pipelines, tracking build statuses, deployment success rates, and other metrics that keep release cycles reliable.
- Annotations: Users can attach detailed annotations to graphs from any connected data source, making it easier to correlate events and diagnose what caused an issue.
- Data Exploration: Ad hoc query capabilities support dynamic drill-downs, including split view comparisons across different time ranges, queries, and data sources side by side.
Advantages of Grafana
Grafana’s biggest strength is how well it adapts to mixed and complex environments. These advantages explain its popularity among platform and SRE teams:
- Versatile Visualization Options: Grafana supports a wide range of panel types, letting teams build comprehensive, easy-to-read visual representations regardless of the underlying data source.
- Multi-Source Support: The platform connects to multiple data sources simultaneously, unifying environments without forcing teams to ingest everything into a single backend first.
- Alerting and Notifications: A built-in alerting engine notifies teams through email, Slack, PagerDuty, and other channels whenever data deviates from defined thresholds.
- Community and Ecosystem: An active community continuously contributes plugins, prebuilt dashboards, and integrations that extend Grafana’s reach into new tools and platforms.
- Collaboration Features: Multiple users can work on shared dashboards simultaneously, which makes Grafana well suited to distributed and cross-functional teams.
Drawbacks of Grafana
Grafana’s flexibility comes with a few operational trade-offs worth weighing early. Review these limitations before standardizing on the platform:
- Performance Concerns: Large data volumes or complex queries can slow dashboards, particularly when the underlying data source is not properly optimized or indexed.
- Learning Curve: Setting up complex dashboards or integrations takes time to master, especially when connecting multiple data sources with different query languages.
- Compatibility Gaps: Integrating with less common databases can require custom plugin development when no native connector already exists.
- Dependency on External Sources: Because Grafana stores no data itself, dashboard reliability depends entirely on the uptime and performance of the connected backends.
Kibana vs. Grafana: Comparison
Both platforms are strong visualization tools, but they were built from the ground up to solve different problems. Grafana centers on monitoring and visualizing metrics such as CPU, memory, and disk usage, tracking how these values shift over time to reveal trends, catch regressions early, and support proactive system security decisions across an entire fleet of servers.
Kibana, by contrast, was designed specifically to explore and analyze log data as part of the broader Elastic Stack. Log analysis remains essential for understanding system behavior, application performance, and security events, and Kibana’s search tools, interactive dashboards, and machine learning-driven analytical capabilities make that process considerably more manageable for technical and security teams alike.
Data Source Integration
Kibana is built specifically to work with Elasticsearch and does not natively support other data sources out of the box. Any external data must first be ingested into the Elastic Stack through Beats, Logstash, or a compatible pipeline before Kibana can search or visualize it, which adds real setup overhead for teams operating outside the Elastic ecosystem entirely.
Grafana supports a wide array of data sources, including Graphite, Prometheus, InfluxDB, MySQL, PostgreSQL, and Elasticsearch, making it a versatile choice for organizations running diverse or fragmented data storage systems. Community and official plugins extend that reach even further, and Grafana Alloy now consolidates telemetry collection across many of these sources under a single OpenTelemetry-based distribution.
Access Control and Authentication
Kibana and Grafana take noticeably different approaches to securing dashboards and controlling data access across teams. Kibana integrates directly with Elasticsearch’s security features, offering fine-grained role-based access control and support for external authentication services such as Active Directory and LDAP. This tight coupling makes it a strong fit for organizations that prioritize granular, security-first access management practices.
Grafana offers flexible authentication options, including built-in user accounts, LDAP, and OAuth integrations with common identity providers. While its access controls are not as deeply layered as Kibana’s Elasticsearch-native security model, Grafana’s emphasis on simplicity makes it popular among teams that want to stand up shared dashboards quickly without wrestling with heavy configuration overhead first.
Querying
Kibana’s standout feature is its robust log querying and search capability, built specifically around Elasticsearch’s indexing model. Users can filter, aggregate, and analyze data using Lucene syntax, KQL, or the more advanced Elasticsearch Query DSL, with results returned in chronological order for fast troubleshooting. These languages are powerful but come with a real learning curve for newcomers.
Grafana excels at time series analytics, making it well suited to monitoring how metrics change over time across an entire environment. It relies on data source-specific query editors rather than one unified language, so users write PromQL for Prometheus, Flux for InfluxDB, or SQL for relational databases, which creates flexibility at the cost of query consistency.
Visualization Options
Both platforms offer extensive visualization libraries, though the way each one builds and organizes dashboards differs meaningfully across teams. Kibana’s visualizations are tightly integrated with Elasticsearch and include line charts, bar charts, pie charts, heat maps, and geographic maps, alongside Canvas for building presentation-quality infographics that go well beyond typical operational monitoring dashboards and reports.
Grafana’s visualization options focus heavily on time series data and dynamic, interactive dashboards built for cross-team sharing. It supports graphs, tables, heatmaps, and free text panels that can pull from multiple data sources at once, and custom panel plugins extend its visual range further, giving it more cross-source flexibility than Kibana overall in mixed environments.
Alerting
Alerting is essential for any monitoring tool, since it converts passive dashboards into active early warning systems that catch problems before users notice them. Kibana now supports native alerting rules in addition to its long-standing Watcher feature, letting teams trigger email notifications, webhooks, or custom integrations whenever data crosses defined thresholds or matches a suspicious pattern.
Grafana offers alerting through its built-in engine, allowing users to create rules based directly on query results across any connected data source in the stack. It supports notification channels including email, Slack, and PagerDuty, and its alert conditions tend to be more consistently customizable out of the box than Kibana’s default free tier configuration allows.
Community
Both platforms maintain large, active developer communities that continue to shape ongoing feature development and long-term roadmap decisions. As of 2024, Kibana had accumulated more than 71,000 commits, roughly 19,100 stars, and around 800 contributors on GitHub, while Grafana had surpassed 48,000 commits, 59,000 stars, and more than 2,000 contributors on the same platform, reflecting Grafana’s broader adoption footprint across the wider observability community.
Comprehensive Comparison Table
A side-by-side view makes the practical differences between the two platforms easier to absorb at a glance:
| Parameters | Kibana | Grafana |
|---|---|---|
| Purpose | Visualization and exploration tool tightly integrated with Elasticsearch as part of the Elastic Stack. | A monitoring and visualization platform supporting metrics from many data sources. |
| Release Date | 2013 | 2014 |
| Use Cases | Log analysis, geospatial analysis, alerting, application performance monitoring. | Monitoring, visualization, alerting, data exploration. |
| Data Integration | Elasticsearch only, natively. | Prometheus, Graphite, InfluxDB, MySQL, PostgreSQL, Elasticsearch, and more via plugins. |
| Visualization | Line, bar, pie charts, heat maps, geographic maps, Canvas. | Graphs, tables, heatmaps, free text panels. |
| Alerting | Native alerting rules plus Watcher. | Built-in alerting engine with broad notification support. |
| Querying | Lucene, KQL, Elasticsearch Query DSL. | Data source-specific editors such as PromQL and Flux. |
| Access Control | Elasticsearch-native RBAC and external authentication. | Built-in auth, LDAP, OAuth. |
| Ease of Use | Intuitive but steeper for complex tasks. | Simpler setup and dashboard creation. |
Licensing, Deployment, and Total Cost of Ownership
Licensing has become a bigger factor in the Kibana versus Grafana decision than it once was, especially for organizations with strict open source procurement policies. Kibana ships as part of the Elastic Stack under the Elastic License v2 or SSPL, and Elastic introduced an AGPLv3 licensing option in 2024, giving organizations considerably more flexibility over how they deploy and modify the software.
Grafana’s core server remains open source under AGPLv3, so self-hosting carries no license cost beyond infrastructure, while Grafana Cloud adds a managed option with usage-based pricing for hosted metrics, logs, and traces. Because Grafana stores no data itself, real spending typically centers on the backends underneath it rather than the visualization layer. Consider these cost drivers before committing to either platform:
- Backend Storage Costs: Grafana’s total cost depends heavily on the databases feeding it, such as Prometheus or Loki, rather than Grafana itself.
- Elasticsearch Cluster Sizing: Kibana’s cost of ownership tracks closely with Elasticsearch cluster size, indexing strategy, and retention policies rather than the visualization layer alone.
- Managed Cloud Options: Both Elastic Cloud and Grafana Cloud offer hosted tiers that trade infrastructure management for predictable subscription pricing.
- Team Expertise: Specialized skills in Elasticsearch Query DSL or PromQL affect onboarding time, and hiring costs more than either tool’s licensing model.
Common Mistakes to Avoid When Choosing a Monitoring Tool
Teams frequently choose between Kibana and Grafana based on surface-level features rather than how well the tool actually fits their existing data architecture and workflows. Avoiding a handful of common missteps early can save months of rework, reduce onboarding friction, and prevent costly dashboard migrations further down the road once adoption has already spread.
- Ignoring the Data Topology: Selecting Grafana for a purely Elasticsearch-centric log workflow, or Kibana for a multi-source metrics environment, forces unnecessary complexity that a better initial match would avoid.
- Underestimating the Learning Curve: Teams often skip training on Elasticsearch Query DSL or PromQL, which slows dashboard adoption long after the tool itself is deployed and running.
- Overlooking Alerting Requirements: Some teams discover mid-migration that their required alerting depth, such as advanced Elasticsearch Watcher conditions, is not available in the free tier of either platform.
- Skipping a Pilot Deployment: Rolling out either platform organization-wide before testing it against real production data often surfaces integration gaps that a smaller pilot would have caught early.
Choosing the Right Tool for Your Needs
Both Kibana and Grafana are powerful tools for data visualization and monitoring, but their ideal use cases diverge. Kibana offers a deeply integrated solution for teams already running the Elastic Stack, providing advanced log analysis that few other tools match. Grafana’s expansive plugin ecosystem and versatility make it the stronger choice for organizations managing diverse data sources and broad monitoring needs.
The right choice ultimately depends on your existing infrastructure, team expertise, budget, and monitoring priorities going forward. Many organizations avoid choosing at all, since the two tools complement each other well in practice: Kibana for deep log forensics within Elasticsearch, and Grafana for a unified, cross-source operational view spanning the rest of the observability stack.
Conclusion
Kibana and Grafana solve overlapping problems from opposite directions. Kibana rewards teams already committed to the Elastic Stack with native log search and tightly integrated dashboards, while Grafana’s data source-agnostic design suits organizations juggling metrics, logs, and traces across multiple backends. Neither tool is objectively superior; the right fit depends entirely on where your data already lives.
Rather than treating this as an either-or decision, evaluate your existing infrastructure, team skill sets, budget, and alerting requirements carefully before committing to either path. Many mature observability stacks run both tools side by side, each handling the workload it does best. Start with a small pilot deployment to confirm the fit before rolling either platform out organization-wide.
Frequently Asked Questions About Kibana vs. Grafana
Can Kibana and Grafana be used together?
Yes, many organizations run both tools simultaneously without conflict. Kibana handles deep, Elasticsearch-native log search and forensics, while Grafana provides a unified dashboard layer spanning metrics, logs, and traces from multiple backends, including Elasticsearch itself through its native data source connector.
Which tool is easier to learn for beginners?
Grafana generally has a gentler learning curve for building basic dashboards, thanks to its drag-and-drop panel editor and visual query builders. Kibana requires more upfront investment, particularly around understanding Elasticsearch index patterns and query syntax, though its Discover and Lens tools have narrowed that gap considerably.
Does Grafana require Elasticsearch to function?
No, Grafana does not require Elasticsearch at all. It works with dozens of data sources, including Prometheus, InfluxDB, Graphite, and SQL databases, and Elasticsearch is simply one optional connector among many rather than a core dependency of the platform.
Is Kibana free to use?
Kibana ships as part of the Elastic Stack and is free to self-host under the Elastic License v2, SSPL, or the newer AGPLv3 option introduced in 2024. Advanced features such as certain machine learning capabilities and enterprise security integrations may require a paid Elastic subscription.
Which tool offers stronger alerting capabilities?
Grafana’s built-in alerting engine is generally considered more accessible out of the box, since it works uniformly across every connected data source. Kibana’s native alerting rules and Watcher feature offer deep integration with Elasticsearch data but historically required a paid subscription for the most advanced conditions.
Suggested articles:
- Data-Driven Project Management: How to Turn Metrics into Meaningful Action
- 3 Tech Trends That Will Dominate the Data Analytics Sector in 2026
- Data-Driven Project Management: Strategies for Smarter Decisions

Daniel Raymond, a project manager with over 20 years of experience, is the former CEO of a successful software company called Websystems. With a strong background in managing complex projects, he applied his expertise to develop AceProject.com and Bridge24.com, innovative project management tools designed to streamline processes and improve productivity. Throughout his career, Daniel has consistently demonstrated a commitment to excellence and a passion for empowering teams to achieve their goals.