
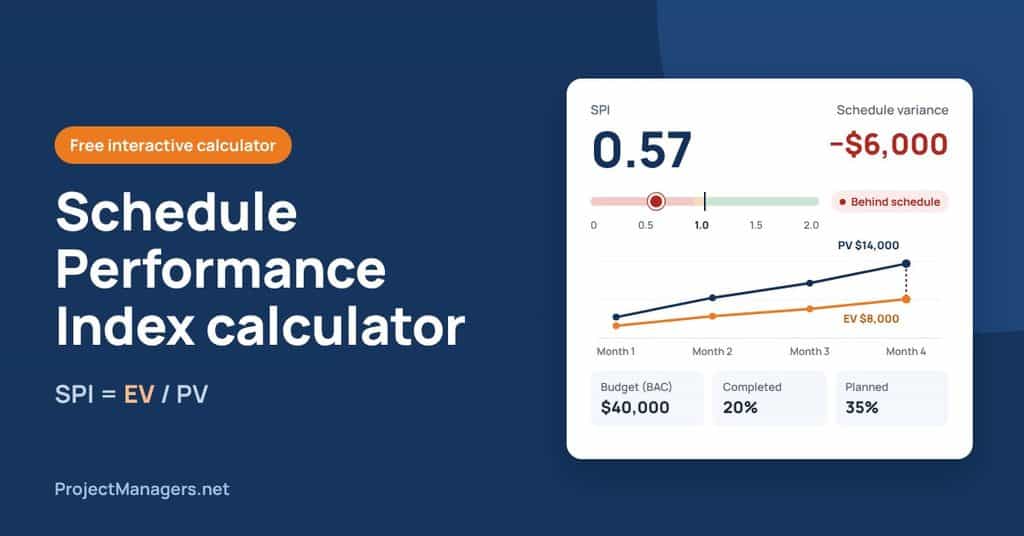
The Schedule Performance Index (SPI) is a key project management metric that evaluates how efficiently a project is progressing compared to its planned schedule. It is calculated by dividing the Earned Value (EV) by the Planned Value (PV). An SPI value below 1.0 indicates the project is behind schedule, while a value above 1.0 shows the project is ahead of schedule or on track.
Key takeaways
- 1
SPI compares the work you have done with the work you planned to do. Divide Earned Value (% complete × BAC) by Planned Value (% planned × BAC): SPI = EV / PV
- 2
1.0 means on schedule. Above 1.0 you are ahead of schedule, below 1.0 you are behind. An SPI of 0.57 means that for every $1 of work planned, only $0.57 of work has been completed.
- 3
Schedule variance shows the gap in money. SV = EV − PV tells you how much work you need to complete to catch up. A negative SV means you are behind schedule.
- 4
Read SPI and CPI together. SPI measures schedule and CPI = EV / AC measures cost, so a project can be behind schedule but under budget, or ahead of schedule but over budget.
- 5
Calculate SPI regularly, and watch the end of the project. Monthly tracking shows whether you are recovering, but SPI always drifts back to 1.0 as the project finishes, even when it finishes late, so check your milestone dates too.
Enter your own numbers and see whether your project is on schedule.
Try Our Free Interactive SPI Calculator Below
This calculator works in your browser. It turns your completion percentages into Earned Value (EV) and Planned Value (PV) as you type, calculates your Schedule Performance Index (SPI) and schedule variance, and shows how much work it takes to get back on schedule. Step-by-step instructions.
Schedule Performance Index (SPI)
0.57
Behind schedule- Earned Value (EV)
- Planned Value (PV)
- Schedule variance (SV = EV − PV)
- Work remaining (BAC − EV)
What it takes
Step 1: the completion percentage of each task
Enter each task’s budget, the % that should be done by now (planned) and the % actually done. The tool adds up EV, PV and BAC across all tasks.
| Task | Task budget | % planned | % complete | PV | EV | SV | SPI | |
|---|---|---|---|---|---|---|---|---|
| Project total |
Project SPI
Tasks pulling SPI down
Calculate SPI at every reporting period
Enter the cumulative (running total) PV and EV at the end of each period, for example once per month.
| Period | Cumulative PV | Cumulative EV | % planned | SV | SPI |
|---|
Cumulative values should never go down from one period to the next. Check the highlighted rows.
Planned Value vs Earned Value
SPI trend
Formulas: EV = % complete × BAC, PV = % planned × BAC, SPI = EV / PV, SV = EV − PV, CPI = EV / AC, CV = EV − AC. SPI compares the value of work done with the value of work planned, not hours.
Instructions to use the SPI calculator above
- Choose your currency and a starting point. Use the “Currency” menu to pick $, €, £ or CAD $, and every amount updates to match. Start in the “Quick SPI” tab for a fast answer. Switch to “By task” to build SPI from each task, or to “Track over time” to follow SPI across reporting periods. To see how different situations play out, load a scenario such as “Article example”, “Ahead of schedule” or “Late finish (SPI drift)”.
- Enter your progress. In “Quick SPI”, type your Budget at Completion (BAC). Then drag the sliders or type the “% of work actually completed” and the “% of work planned to be completed”. If you already know your Earned Value and Planned Value, click “Enter EV and PV” and type them directly. Add your Actual Cost (AC) if you also want to compare CPI vs SPI.
- Read your SPI. The calculator shows your SPI with the full working: EV = % complete × BAC, PV = % planned × BAC, and SPI = EV / PV. The gauge and the colored label show whether you are ahead of schedule, on schedule, slightly behind or behind schedule. Below that you get the schedule variance (SV = EV − PV), a plain-language reading such as “For every $1 of work planned, you have completed $0.57 of work”, and your CPI and cost variance if you entered AC.
- See what it takes to catch up. The “What it takes” box shows how much more work, as a percentage and in money, you need to complete to bring SPI back to 1.0 at this date.
- Go task by task, track over time and save your results.
- In “By task”, list each task with its budget, % planned and % complete, and click “Add task” to add more. The tool totals EV, PV and BAC, calculates the project SPI, and highlights the tasks pulling SPI down.
- In “Track over time”, enter the cumulative PV and EV for each reporting period and click “Add period” to add more. The charts plot your PV and EV curves and your SPI trend against the 1.0 line. Once more than 80% of the planned work is behind you, a note explains why SPI drifts back to 1.0 near the end of a project, even when it finishes late.
- Click “Copy results” to paste your numbers into an email, report or project plan, or “Print” for a clean one-page summary.
Tip: your entries are saved in this browser, so you can close the page and pick up where you left off. Recalculate SPI at every reporting period, such as once a month, instead of treating it as a one-time check. A single SPI is a snapshot, and the trend tells you whether your corrective actions are working.
Why is SPI so Important?
The Schedule Performance Index (SPI) helps project managers identify potential issues early and take corrective actions to keep the project on track. By providing a clear and concise measure of progress, SPI enables teams to evaluate the current status of a project, forecast future performance, and compare results across multiple projects.
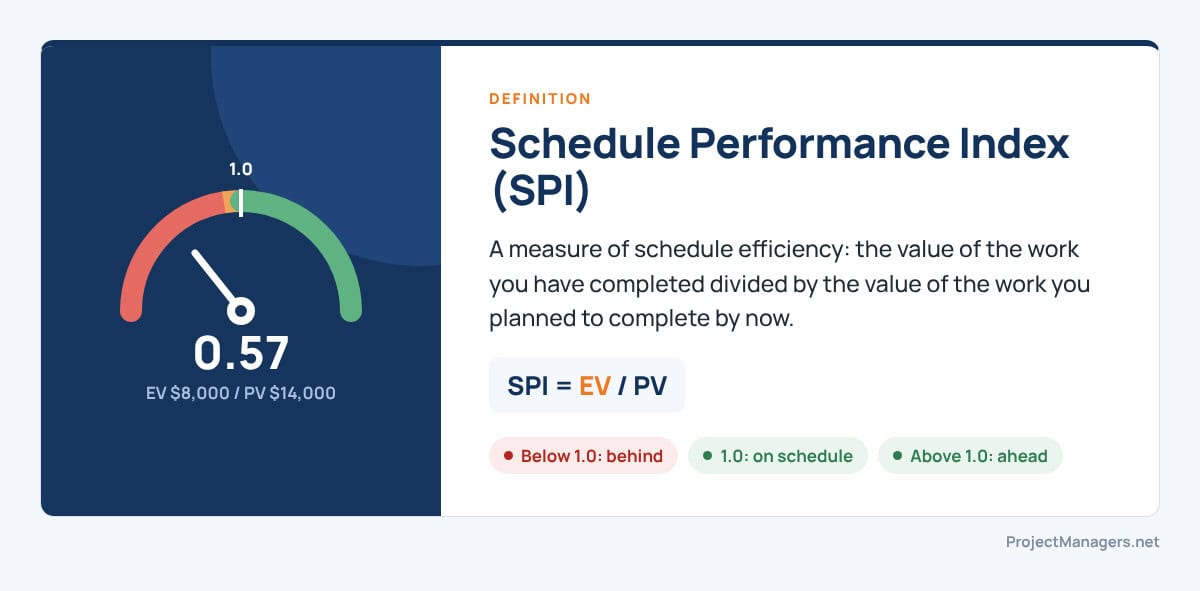
As a critical performance indicator, SPI provides valuable insights into project progress by comparing the actual work completed against the planned work. This makes it a powerful tool for predicting the likelihood of meeting project deadlines.
SPI not only measures the efficiency of a single project but can also be used to benchmark performance across multiple projects or even entire organizations. For instance, an SPI of 0.8 suggests that, on average, projects are operating at 80% efficiency. This allows project managers to identify trends, compare results, and apply best practices to improve overall performance.
3 Strategic Advantages of Using SPI in Project Management
In order to effectively manage a project, it is important to have a clear understanding of how well the project is progressing. Overall, these 3 key benefits will directly impact your future projects.
- Improves the efficiency and effectiveness of project management processes.
- Assess the health of a project and identify areas where changes need to be made in order to improve project performance right away.
- Use it to compare the performance of multiple projects by identifying best practices to apply in future projects
How to Calculate the Schedule Performance Index
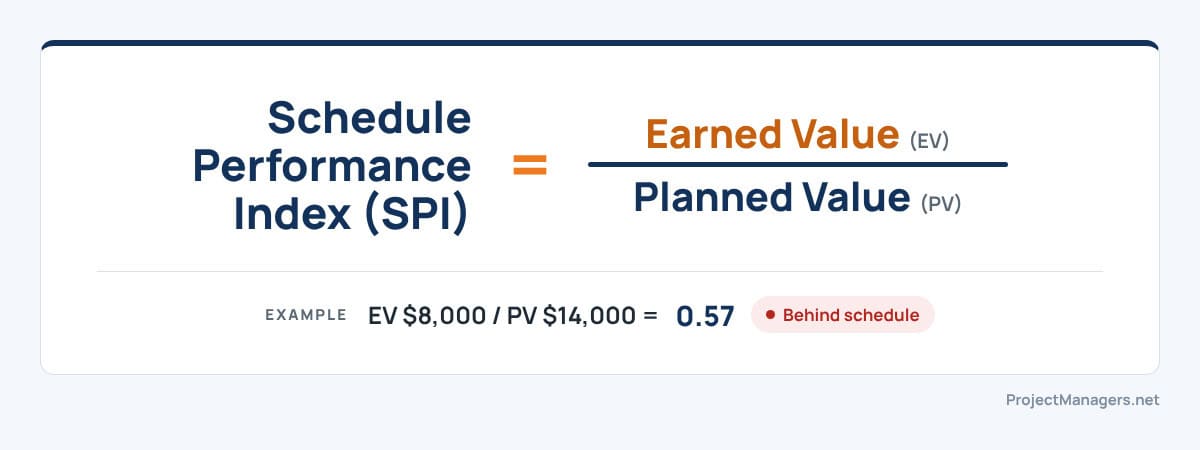
The project manager can calculate the Schedule Performance Index by dividing the Earned Value (EV) by the Planned Value (PV). The earned value must be calculated on a task-by-task basis and added together. The project managers may use this as a benchmark to measure the schedule by referring to the schedule baseline.
Calculate the Completion Percentage of Each Task
Review each task in the work breakdown structure and record how much of it is complete. Multiply each task’s completion percentage by its budget, then add the results. That total is the project’s Earned Value (EV), and dividing it by the BAC gives the overall percentage of work completed.
Calculate the Earned Value (EV)
Earned Value is the budgeted value of the work actually completed, also called the Budgeted Cost of Work Performed (BCWP). It is often referred to as the Budgeted Cost of Work Performed (BCWP). It is calculated using the project’s budget.
EV = Actual percentage of completion * Budget at completion (BAC)
Calculate the Planned Value (PV)
Planned Value is the budgeted value of the work scheduled to be completed by the status date, also called the Budgeted Cost of Work Scheduled (BCWS). Per PMBOK, PV is the budgeted cost for the work scheduled to be done.
Planned Value = (Planned % Complete) X (BAC)
Calculate the Schedule Performance Index (SPI)
SPI formula – the earned value is divided by the planned value to get the value of the schedule performance index. An SPI of 1.0 indicates that the project is on schedule, while an SPI of less than 1.0 indicates that the project is behind schedule.
Calculate Schedule Performance Index Example
SPI Example – Imagine this, you are a project manager whose budget is $40,000 for a new computer program in the Software Development Company you work for. As time goes by, 20% of the work is completed, but it is against your 35% initial plan, and you have spent $25,000 already.
- Project Budget = $40,000
- Earned Value (EV) = 20% of $ 40,000 = $8000
- Planned Value (PV) = 35% of $ 40,000 = $14,000
- Schedule Performance Index (SPI) = 8000/14000
- Therefore, The Schedule Performance Index (SPI) = 0.57
- And as 0.57 is less than 1, that means the project is behind schedule.
There are several factors that can affect SPI:
- One is the quality of the schedule itself. A well-designed schedule will take into account known risks and potential changes that could affect the schedule.
- Another factor is the organization’s ability to execute the schedule. This includes having the right resources in place and being able to work effectively as a team.
What Causes SPI To Be Greater Or Less Than One?
There are a few factors that can cause SPI to be greater or less than one:
- The first is the distribution of the data. If the data is evenly distributed, SPI will be close to one. However, if the data is skewed, SPI will be further from one.
- The second factor is the number of data points. The more data points there are, the closer SPI will be to one.
- The last factor is the type of data. Some data types are more likely to have outliers, which can cause SPI to be further from one.
Schedule Variance
A project’s schedule variance serves as a gauge for whether it is on time or not. It is frequently used in earned value management (EVM) to give project managers an update on the status of the work during the analysis stage. Due to the fact that it provides project managers with an accurate view of the project’s progress, schedule variance is critical for project management.
To keep the project moving forward, project managers must be able to recognize any obstacles as they materialize and take swift action to remove them. It’s crucial to manage stakeholder expectations when there are timetable variances. Project managers obtain useful information and data to present at stakeholder meetings when they compute schedule variation. These numbers can reassure project stakeholders that everything is going according to plan.
How Often and When Should You Calculate SPI?
SPI can be used to assess the progress of a project at any given time, but it is most commonly used during the monitoring and control phase of a project. SPI can be calculated at any point during a project, but it is most useful when calculated on a regular basis, such as once per month. This allows for early detection of schedule problems and allows for corrective action to be taken before the project falls too far behind schedule.
Limitations of the Schedule Performance Index
While the SPI is a useful metric, it is important to remember that it only tells part of the story. The SPI does not take into account the quality of the work that has been completed or the actual costs incurred. For this reason, the SPI should be used in conjunction with other measures of project performance.
SPI is also measured in money, not time, and it always returns to 1.0 at the end of a project. Once all the work is done, EV equals PV, so a project that finishes three months late still ends with an SPI of 1.0. In the final stages, check milestone dates rather than relying on SPI, or use Earned Schedule (ES), which measures schedule performance in time units.
CPI vs SPI
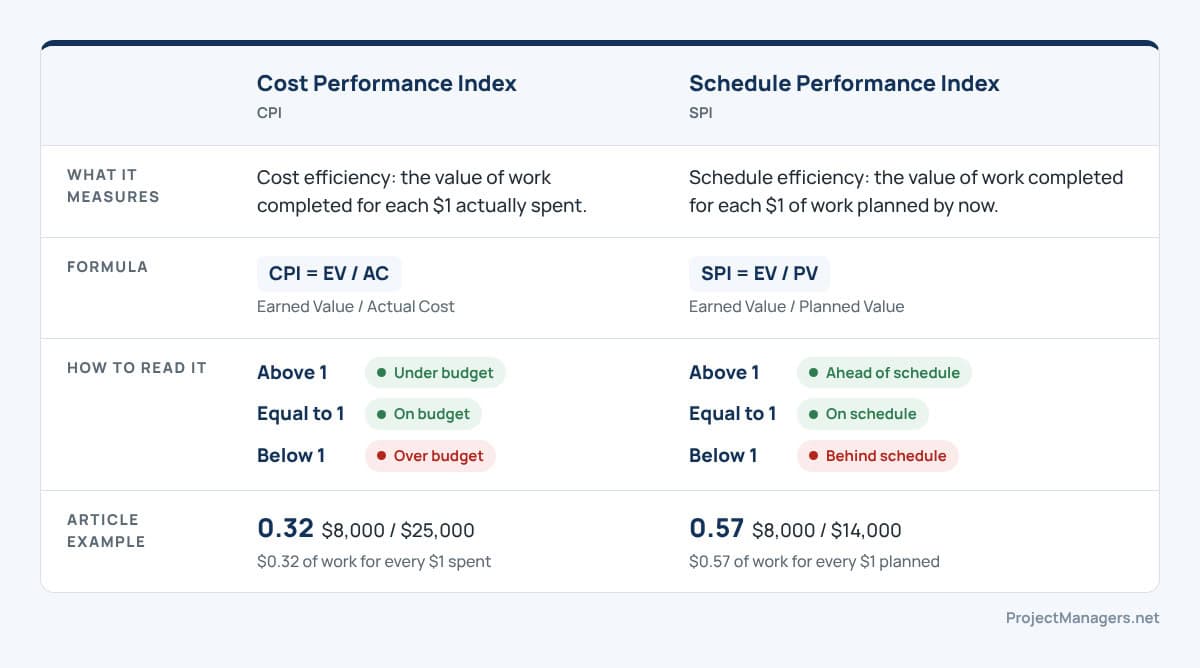
Cost performance index (CPI) and schedule performance index (SPI) are two measures that are often used in project management. They are both used to assess the performance of a project and to compare it to the baseline. They are both used to assess the performance of a project and to compare it to the baseline.
CPI and SPI are both important measures to consider when assessing the performance of a project. However, they should not be used alone. Instead, they should be used in conjunction with other measures, such as project milestones and project objectives, to get a full picture of the project’s performance.
Schedule Formulas During the PMP Exam
There are two formulas that are often tested during the Project Management Professional (PMP) Exam: the Schedule Performance Index (SPI) and the Cost Performance Index (CPI). Both of these formulas are central to earned value management (EVM) and are critical for assessing how well a project is performing in terms of schedule and cost.
- Schedule Performance Index (SPI): Measures how much of the planned work has been completed, in value terms. It is calculated as SPI = EV ÷ PV. An SPI greater than 1 indicates the project is ahead of schedule, while an SPI less than 1 means the project is behind schedule.
- Cost Performance Index (CPI): Measures cost efficiency by comparing the value of work performed to the actual cost incurred. It is calculated as CPI = EV ÷ AC. A CPI greater than 1 means the project is under budget, while a CPI less than 1 means it is over budget.
On the PMP exam, you may encounter questions that test your ability to apply these formulas in different contexts. For example, you could be asked to calculate SPI or CPI based on provided project data, or to interpret what the results mean for project performance. While the exam also covers broader project management concepts such as Schedule and Budget Contingency, Cost Collection Systems, and the Change Management Process, the SPI and CPI formulas remain essential tools you must know by heart.
To prepare effectively:
- Memorize both formulas and practice applying them to different scenarios.
- Understand the relationship between SPI, CPI, and overall project health.
- Be able to interpret results and explain what they mean for project decision-making.
Although you won’t be asked to perform lengthy calculations during the exam, you will need to quickly recognize when a project is over budget, under budget, ahead of schedule, or behind schedule based on SPI and CPI results. This knowledge will help you answer situational questions with confidence and demonstrate your mastery of earned value management principles.
FAQs
What is SPI?
The Schedule Performance Index (SPI) is a project management metric that measures how efficiently a project is progressing compared to its planned schedule. It is calculated by dividing Earned Value (EV) by Planned Value (PV), helping managers evaluate schedule adherence and performance.
Why is SPI important during a project?
The SPI is important because it provides early warning signs of schedule delays, allowing project managers to take corrective actions before issues escalate. By monitoring SPI, teams can improve efficiency, maintain stakeholder confidence, and increase the likelihood of meeting project deadlines successfully.
What if SPi is less than 1?
If the SPI is less than 1, it means the project is behind schedule, as less work has been completed than originally planned. Investigate the cause, which could be slow execution, a late start, resource shortages or an unrealistic baseline. A value slightly below 1.0 may only need monitoring, while a value well below 0.9 usually calls for corrective action.
What does an SPI of 0.75 mean?
An SPI of 0.75 means the project team is only achieving 75% of the planned work within the scheduled timeframe. In practical terms, for every planned hour of work, only 0.75 hours are completed, signaling significant schedule delays and inefficiencies.
Suggested articles:
- How to Calculate Cost Performance Index with Examples
- 11 x Executive Project Status Report Template – Word, Excel
- Project Schedule Quality 101: 14 Ways to Improve Schedule

Shane Drumm, holding certifications in PMP®, PMI-ACP®, CSM, and LPM, is the author behind numerous articles featured here. Hailing from County Cork, Ireland, his expertise lies in implementing Agile methodologies with geographically dispersed teams for software development projects. In his leisure, he dedicates time to web development and Ironman triathlon training. Find out more about Shane on shanedrumm.com and please reach out and connect with Shane on LinkedIn.