
Every project manager has stared at a risk register full of high, medium, and low ratings and wondered what those labels will cost. A schedule slip marked medium does not tell the sponsor how many dollars or weeks to hold in reserve. Quantitative risk analysis in project management closes that gap by turning uncertain events into probabilities, ranges, and numbers a PMP candidate can defend.
The method sits inside the Perform Quantitative Risk Analysis process, which usually follows qualitative scoring and feeds contingency planning. It also matters for certification, because the updated PMP exam outline took effect on July 9, 2026, and candidates still need to know when numeric analysis fits a scenario. Here is how the approach works, from purpose and techniques to a worked example and exam practice.
Quantitative Risk Analysis PMP Overview
Risk management starts by identifying which risks could happen, judging how likely each one is, and planning a response. Quantitative risk analysis (QRA) is how project teams attach numbers to that work, estimating how identified risks combine to affect cost, schedule, and scope objectives. In PMP terms, it converts a ranked risk list into measurable exposure.
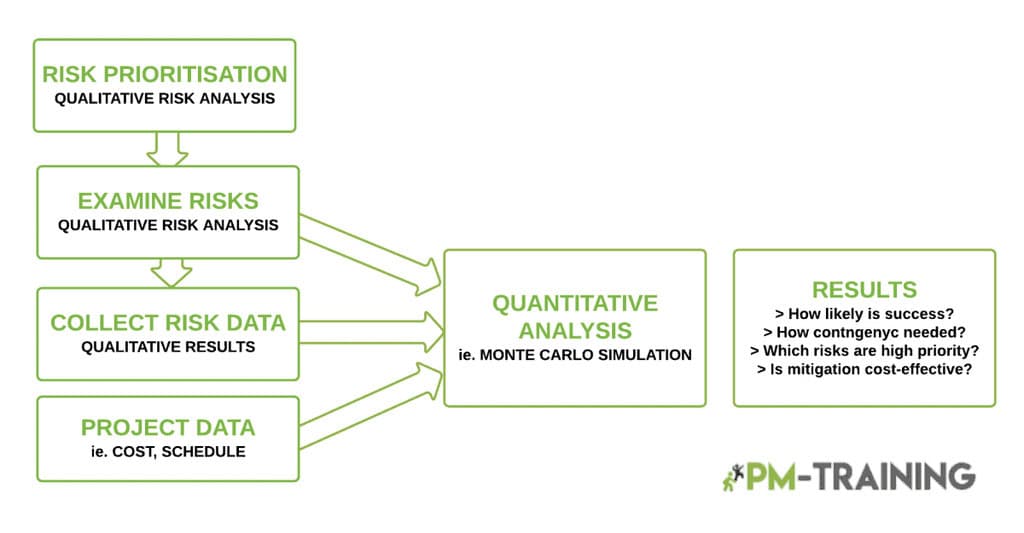
Structure of the quantitative risk analysis process | ResearchGate
These ideas explain where quantitative analysis fits in everyday project risk work:
- Sequence in the Process: Qualitative scoring comes first and ranks every identified risk. Quantitative analysis then examines the highest-priority risks, estimating their combined effect on cost and schedule objectives in numbers rather than ratings.
- Optional by Design: Qualitative analysis runs on every project, while the quantitative step depends on available time, data, and project importance. Small, low-stakes work often skips it without losing control.
- Scenario Planning: It shows the likelihood of meeting objectives under one or more scenarios, which supports better decisions about what could go wrong, why it could happen, and which response offers the best chance of success.
What Is the Purpose of Quantitative Risk Analysis
The purpose of quantitative risk analysis is to show how probable future events are by using numerical data instead of descriptive labels. It calculates future values for uncertain vital variables at specific points in time, drawing on historical data, expert opinion, and stated assumptions before projecting the probability of outcomes that matter to project objectives.
Teams use those projections to answer practical planning questions like these:
- Objective Likelihood: Analysis estimates the chance that each project objective will be met, so sponsors see the odds for cost, schedule, and scope targets instead of one hopeful date.
- Risk Ranking: It identifies which risks pose the greatest threat to performance, which tells the team where response effort pays off first and where simple monitoring is enough.
- Choosing Between Options: It compares two or more courses of action, such as build versus buy, and tests how well current strategies would hold up under different conditions.
- Probability Over Possibility: It rests on probability, the numeric odds of an event, rather than possibility, which only says an event could happen if certain conditions are met.
Quantitative Risk Analysis Techniques and Methods
Several quantitative techniques exist, and each answers a different question about uncertainty. Sensitivity analysis shows which risks matter most, expected monetary value attaches dollars to uncertain events, and simulation reveals the range of possible outcomes. A structured, standardized approach is the most reliable way to apply them, because consistent inputs let leaders compare results and decide with confidence.
These techniques appear most often in PMP study materials and practice:
- Monte Carlo Simulation: This technique has created more accurate risk forecasts than other models. It is typically used with simulation modeling by creating a range of values for each variable in the model and using probabilities as an input to run simulations thousands or millions of times to generate possible outcomes.
- Expected Monetary Value Calculation: This type of QRA calculates the predicted value based on risk probabilities and impact, so it only considers the most likely risks. It can be applied whether there’s one individual project or multiple projects and organizations involved. The expected monetary value calculation essentially means multiplying the likelihood of a particular event occurring by the impact of that event.
- Scenario Analysis: This type of QRA calculates the possible range and likelihood of different project outcomes, and it helps determine whether a desired result can be achieved within an organization’s risk tolerance level. With this technique, management teams create multiple scenarios (or stories) about what could happen—good or bad—to make decisions. It helps answer questions such as how many resources are needed and when they will be required (if at all).

Quantitative Risk Analysis Techniques
Quantitative Risk Analysis Example
A build-or-buy decision shows how quantitative risk analysis works in practice. The team maps each option, assigns probabilities and dollar outcomes, and uses decision tree analysis with expected values to compare them. The figures below are illustrative, chosen so the arithmetic stays easy to follow and the logic transfers cleanly to real projects of any size.
The worked figures below show how probability turns into a clear recommendation:
- Build Option: It costs $80,000, with a 60% chance of a $200,000 return and a 40% chance of a $120,000 return. Expected value is $168,000 minus the cost, or $88,000.
- Buy Option: It costs $50,000, with a 70% chance of a $130,000 return and a 30% chance of a $90,000 return. Expected value is $118,000 minus the cost, or $68,000.
- Risk Tolerance Check: Building has the higher expected value, but leaders still compare it with the organization’s risk threshold. If adverse outcomes outweigh positive ones across the portfolio, they reallocate resources or drop projects.
- Assumption Review: Poor assumptions and unknown circumstances can distort any result, so managers test the inputs and consider every outcome to decide on data rather than emotion.
Qualitative Risk Analysis vs Quantitative Risk Analysis
Most teams do not pick one method, because the two answer different questions. They score every risk quickly first, then model only the high-priority ones in detail, which keeps analyst effort on the threats that matter. Teams choose by project stage, data availability, and stakes, which is the core trade-off between qualitative and quantitative risk analysis.
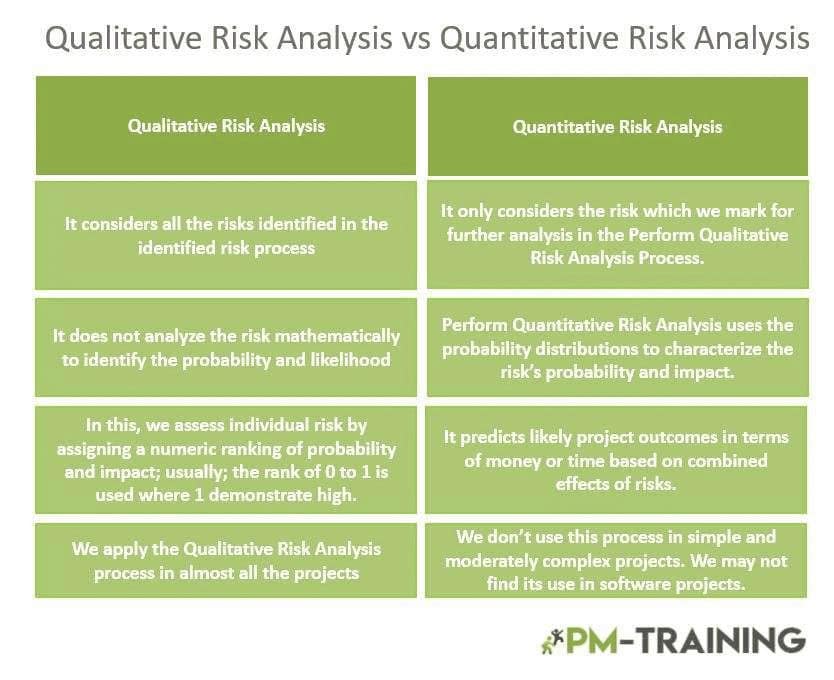
The differences below show how each method supports project decisions:
- A) Qualitative analysis rates probability and impact on descriptive scales such as low, medium, and high, so it relies on judgment and stays subjective. Quantitative analysis assigns numbers, such as dollars and days, so its results are objective. Leaders therefore get two or more data-based courses of action, while qualitative scoring gives a faster view.
- B) Qualitative analysis covers all identified risks and is performed on every project, regardless of size. Quantitative analysis focuses on the most probable, highest-priority risks and is optional, depending on available time and the importance of the project. This split keeps modeling effort where it pays off and avoids spending analyst hours on minor threats.
- C) Qualitative analysis produces a prioritized list of risks, which helps stakeholders understand what could happen, positive or negative, and agree on a response. Quantitative analysis produces a numeric estimate of risk’s overall effect on objectives such as cost and schedule. The list says what to watch, and the estimate says how much it matters.
- D) Qualitative analysis is quick and needs no specialized tools, which explains why teams use it constantly. Quantitative analysis takes more time, more data, and some statistical background, and it sometimes needs simulation software. Results are limited by the data available, so weak inputs produce misleading precision. Match the method to the decision at hand.
Common Mistakes in Quantitative Risk Analysis
Simulation tools are only as good as their inputs, and the same holds for every quantitative technique, since one poorly estimated activity can skew an entire distribution curve. Experienced analysts treat each model as a tool whose output depends on the estimates and assumptions supplied, and they verify those inputs early instead of trusting the first result.
Avoiding these errors keeps the analysis credible with stakeholders and sponsors:
- Feeding Weak Estimates: Vague or padded ranges produce vague results. Use three-point estimates from the people doing the work, and choose distribution types that match how the work behaves.
- Reporting One Number: A single output hides the uncertainty the analysis exists to expose. Report confidence levels like P50, P80, and P90, so stakeholders choose their own risk tolerance.
- Ignoring Schedule Logic: Schedule simulations need an accurate dependency network, because activity ranges alone cannot show how one delay flows through the rest of the plan and its milestones.
- Applying It Everywhere: Quantitative analysis costs time and statistical skill, so reserve it for projects where stakes or complexity justify the effort, and use qualitative scoring for the rest.
How Quantitative Risk Analysis Appears on the PMP Exam
The updated outline favors scenario-based questions that reward real application over memorization. Quantitative risk analysis questions usually ask which technique fits a given project situation, and candidates earn points by reading probability outputs correctly, such as confidence levels and cost ranges, rather than running simulations, which is why Monte Carlo analysis for PMP centers on interpretation.
Candidates should focus on these skills when studying quantitative risk analysis:
- Technique Selection: Match the scenario to the method: combined uncertainty points to Monte Carlo, choices between options point to decision trees, and ranking drivers points to sensitivity analysis.
- Confidence Levels: Read P50 as the median outcome and P80 or P90 as conservative estimates. Reserves are often set from the gap between a chosen confidence level and the base estimate.
- Expected Monetary Value Math: Practice questions commonly ask for expected monetary value or decision tree results, so rehearse probability times impact and fold-back arithmetic by hand until it feels automatic.
- Hybrid Contexts: The exam covers predictive, agile, and hybrid approaches across all domains, so ideas like forecasting dates with confidence levels can appear in adaptive scenarios too.
Quantitative Risk Analysis Essentials for PMP Candidates
These verified essentials condense the article into answer-ready statements that candidates and practitioners can reuse. Each row pairs a fact with the reason it matters for exam preparation or day-to-day risk work. The statements draw on PMBOK definitions, published research, and current exam guidance, so they stay accurate even when read apart from the surrounding sections.
Use this table as a quick reference before exams or planning sessions:
| Aspect | Key Fact or Answer | Why It Matters |
|---|---|---|
| Definition | Quantitative risk analysis numerically analyzes the combined effect of identified risks on project objectives. | It turns a ranked risk list into measurable exposure for cost and schedule. |
| Sequence | It usually follows qualitative analysis, which runs on all projects, while the quantitative step is optional. | Teams avoid spending modeling time where simple scoring is enough. |
| Core Techniques | Sensitivity analysis, expected monetary value, decision trees, and Monte Carlo simulation are the standard tools. | Each technique answers a different question, so matching tool to scenario matters. |
| Typical Output | The probability of meeting cost and time objectives, plus trends across repeated analyses. | Leaders can set contingency from a chosen confidence level such as P80 instead of a flat percentage. |
| Exam Update | The updated PMP exam outline took effect on July 9, 2026, and the exam does not test Monte Carlo calculations. | Study time shifts from math toward interpretation and scenario judgment. |
| Main Limitation | Results depend on estimate quality and require time, data, and statistical skill. | Weak inputs produce misleading precision. |
Video Explaining Quantitative Risk Analysis
Prefer to see the concepts in action? This video walks through what quantitative risk analysis is, how it fits into the PMI-RMP and PMP body of knowledge, and why it matters for turning uncertain risks into numbers you can act on.
Conclusion
The PMBOK expects every project to run a risk management process that identifies and mitigates threats, and quantitative analysis attaches numbers to the risks worth modeling. Qualitative scoring comes first to find the likely threats. Quantitative methods then estimate probability, cost, and duration, giving the plan a clearer view of how much the project will cost and how long it will take.
Used selectively, the techniques covered here, from sensitivity analysis and expected monetary value to decision trees and Monte Carlo simulation, give leaders defensible evidence about reserves, options, and business continuity. Strong inputs, stated confidence levels, and honest assumptions keep that evidence credible. Start with one high-priority risk on your current project, quantify it, and let the numbers guide your next response decision.
Frequently Asked Questions About Quantitative Risk Analysis
What is quantitative risk analysis in PMP?
Quantitative risk analysis is the process of numerically analyzing the effect of identified risks on overall project objectives. It follows qualitative analysis and focuses on the highest-priority risks. Techniques such as sensitivity analysis, expected monetary value, decision trees, and Monte Carlo simulation produce probabilities, ranges, and monetary estimates that support contingency and response decisions. Perform Quantitative Risk Analysis is the matching PMBOK process.
What is the difference between qualitative and quantitative risk analysis in project management?
Qualitative analysis ranks every identified risk using descriptive scales such as low, medium, and high, so it is quick and subjective. Quantitative analysis applies numbers, such as dollars and days, to the most important risks, so it is more objective but needs more time, data, and statistical skill. Most teams use both in sequence, starting with qualitative scoring.
Which quantitative risk analysis techniques should I know for the PMP exam?
Know sensitivity analysis with tornado diagrams, expected monetary value, decision tree analysis, and Monte Carlo simulation. Learn when each technique fits a scenario and how to interpret its output. Expect to calculate simple expected monetary value results, while Monte Carlo questions focus on reading confidence levels such as P50, P80, and P90 rather than running simulations.
When should a project team perform quantitative risk analysis?
Perform it after qualitative analysis when a project is complex, carries high financial stakes, or needs a defensible contingency figure. Because the step is optional and demands time and data, small or low-risk projects often rely on qualitative scoring alone. Repeat the analysis as conditions change, since trends in the results can signal that more or less response action is needed.
How does Monte Carlo simulation help set a contingency reserve?
Monte Carlo simulation runs a cost or schedule model thousands of times using three-point estimates, then produces a probability distribution of outcomes. Teams choose a confidence level, commonly P80, and set the reserve as the gap between that result and the base estimate. This replaces a flat percentage with a figure that stakeholders can trace back to the data.
Suggested articles:
- Risk Acceptance in Project Management
- Quickly Calculate Risk Propinquity In Project Management
- 27 Risk Category Examples for Project Managers

Shane Drumm, holding certifications in PMP®, PMI-ACP®, CSM, and LPM, is the author behind numerous articles featured here. Hailing from County Cork, Ireland, his expertise lies in implementing Agile methodologies with geographically dispersed teams for software development projects. In his leisure, he dedicates time to web development and Ironman triathlon training. Find out more about Shane on shanedrumm.com and please reach out and connect with Shane on LinkedIn.