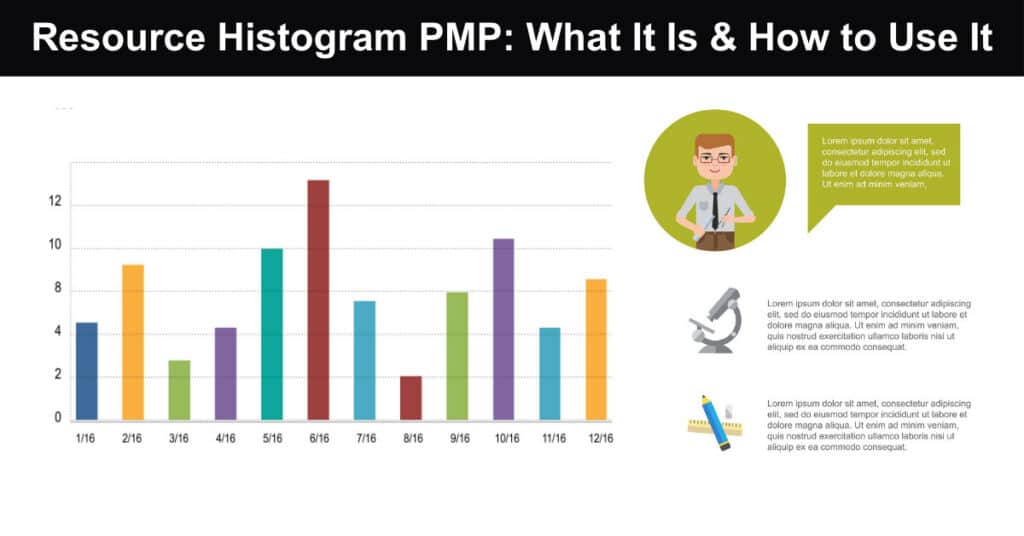
A resource histogram is a graphical representation that displays the planned start and finish dates for individual resources and the duration of their corresponding tasks. This visualization tool serves to identify potential resource bottlenecks and ensure adequate resource availability throughout the project lifecycle. Resource histograms can be efficiently created using standard software applications such as Microsoft Excel.
It represents how much time is required to complete a project, task, or activity. It is used in project management to help visualize the allocation of resources and identify potential bottlenecks. Project managers have to wear a lot of hats. They need to be able to juggle multiple tasks, prioritize effectively, and stay organized. They also need to be able to effectively communicate with their team. One of the most important tools in a project manager’s toolbox is the resource histogram.
What You Should Know About a Resource Histogram
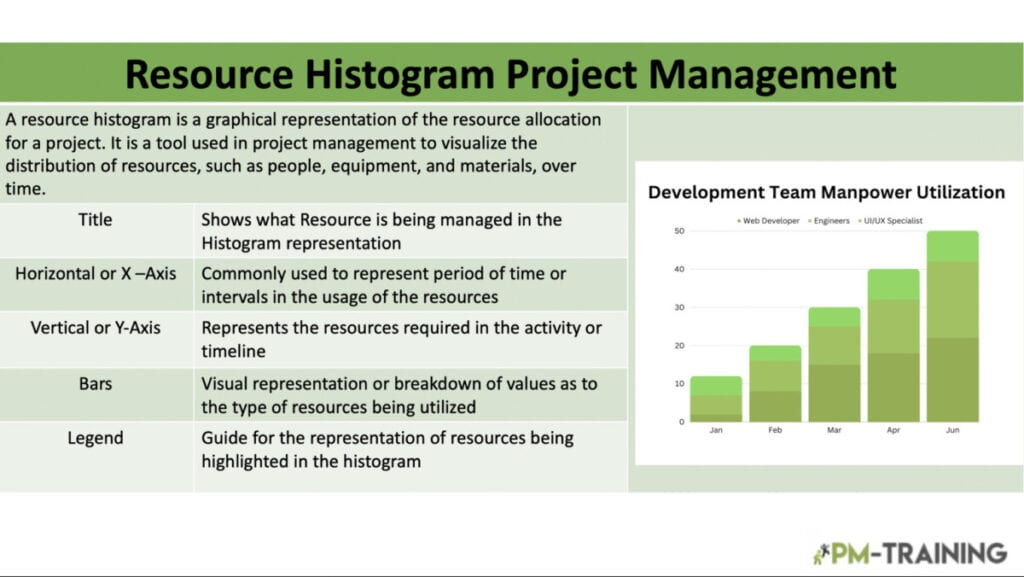
A resource histogram is a type of stacked bar chart that shows the distribution of resources (e.g., people, materials, equipment, etc.) across a project timeline. It is a valuable tool in any project manager’s toolkit. It provides a clear and concise way to visualize the distribution of work among your team members. It can also help you identify potential bottlenecks and optimize your project timeline.
- Identify potential bottlenecks
- Allocate resources more effectively
- Optimize the use of resources
- Helping to identify potential resource shortages or bottlenecks
- Allowing for better visualization of how resources are being used
- Facilitating communication between team members
- Improving project planning and execution
- Helping to make more efficient use of resources
Why Do Resource Histograms Matter in Project Management?
This information is valuable because it can help you identify potential risks and areas of a bottleneck. If you know where your resources are allocated, you can more easily identify where changes need to be made in order to optimize the use of resources. Resource histograms also help you understand the impact of changes. For example, if you need to add a new task to your project, a resource histogram can help you understand how that will impact the rest of your project.
- Will it throw off your timelines?
- Will you need to reallocate resources?
A resource histogram can help you to answer these questions and plan accordingly. Professionals seeking to enhance their understanding of project management tools often pursue structured PMP Courses to deepen their knowledge of resource planning and scheduling techniques.

Pros and Cons of Resource Histogram
A resource histogram is a graphical representation of how resources are distributed across a project. It can be used to identify potential bottlenecks and optimize resource utilization.
Pros
- It can help you identify project phases that are resource-intensive and plan accordingly.
- It can help you track resource utilization over time and make necessary adjustments.
- It can help you forecast future resource needs and avoid potential shortages.
Cons
- It requires accurate data, which can be difficult to obtain.
- It can be difficult to interpret, especially for complex projects.
- It does not take into account the dependencies between tasks, which can impact resource utilization.
How to Create a Resource Histogram
A resource histogram allows you to visualize how resources are being utilized over time. This is a valuable tool for project managers as it can help identify issues and areas of improvement. There are a few steps to creating a resource histogram. This step-by-step guide will show you how to create a resource histogram in Excel, so that you can better manage your time and resources.
Gathering Data
The first step in creating a resource histogram is to gather data on the resources required for the project. This data can be collected from project plans, task lists, etc. Once all of the data has been gathered, it should be organized into a table or spreadsheet. Collect data on resource utilization over a period of time. This data can be collected manually or through automated means.
Creating the Histogram
The next step is to create the histogram itself. This can be done using Microsoft Excel or another software program that supports histograms. To create the histogram, simply input the data from the table or spreadsheet into the appropriate fields and select the “histogram” option.
Analyzing the Results
Once the histogram has been created, it should be analyzed to identify any potential resource shortages or bottlenecks. Interpret the results and identify areas of improvement. If there are any areas of concern, steps should be taken to address them. For example, if there is a potential resource shortage, additional resources may need to be allocated to the project.
Implementing Changes Based on Your Findings
Generally, anything that falls outside of the normal range is considered an outlier and should be investigated further. Outliers could indicate errors in the data, unusual circumstances, or simply that more information is needed about a particular task or activity. By following these steps, you can create a resource histogram that will help you better understand how resources are being used on your project.
Best Practices for Creating Resource Histograms
When developing a resource histogram, following established best practices ensures accuracy and maximizes the value of your analysis. Consider these key recommendations:
1. Ensure Data Accuracy and Quality
Maintain reliable data sources and precise measurements throughout your data collection process. Gather information from a representative sample of your project population to ensure results are statistically sound and free from bias caused by outliers.
2. Maintain Consistent Time Intervals
Utilize uniform time periods when collecting and displaying data. This consistency enables clearer pattern recognition and facilitates more accurate trend analysis. Apply appropriate analytical tools and methodologies to ensure comprehensive data interpretation.
3. Implement Clear Visual Standards
Label all axes clearly and comprehensively to enhance data interpretation. Include descriptive titles that clearly communicate the histogram’s purpose and scope, enabling stakeholders to quickly understand the resource allocation patterns being presented.
4. Communicate Results Effectively
Present findings in a clear, actionable format that enables informed decision-making. Provide context for your analysis and highlight key insights that impact project planning and resource management strategies.
By adhering to these best practices, project managers can create resource histograms that provide reliable insights for optimizing resource allocation and identifying potential project constraints.
Resource Histogram PMP Questions
How can a resource histogram impact a project timeline?
- By resource availability
- By project duration
- By project complexity
Answer: By resource availability
What type of bar chart shows the distribution of resources across a project timeline?
- Pareto Chart
- Bar Chart
- Gantt Chart
- Resource Histogram
Answer: Resource Histogram
What type of information can a resource histogram provide?
- How many resources are required to complete a task
- How much work has been assigned to different resources
- How many total resources are required to complete the project
- How resources are distributed across a project
Answer: How resources are distributed across a project
How does the use of resource histograms help make more efficient use of resources?
- Reducing the number of failed projects
- Reducing the amount of data needed to be processed
- Preventing project overruns
- Improving project planning and execution
Answer: Improving project planning and execution
Video About Resource Histogram
Watch this quick video to learn how a resource histogram helps project managers spot bottlenecks, balance workload, and optimize allocation. In 40 seconds, see a clear Excel example and three practical tips to make your scheduling smarter and keep projects on track.
Conclusion
Resource histograms are indispensable tools for effective project management, offering clear visual insights into resource allocation and utilization patterns. By implementing the best practices outlined in this guide—ensuring data accuracy, maintaining consistent time intervals, and following clear visual standards—project managers can leverage these powerful charts to identify bottlenecks, optimize resource distribution, and make informed decisions throughout the project lifecycle.
While creating resource histograms requires careful attention to data quality and proper interpretation, the benefits far outweigh the challenges. From preventing resource shortages to improving project planning and execution, resource histograms empower project managers to deliver successful outcomes while maximizing efficiency. Mastering this visualization technique is essential for any project manager seeking to enhance their resource management capabilities.
FAQs
What is a resource histogram?
A resource histogram is a visualization tool that can help project managers see how resources are being used over time. This can be a valuable tool for identifying issues and areas of improvement.
Why do resource histograms matter in project management?
Resource histograms help you plan for the future. They can be used to create forecasting models that can help you predict future resource needs. This information is valuable when it comes time to budget for your next project.
What are the benefits of using a resource histogram?
There are many benefits to using resource histograms in project management. Some of these benefits include: detecting potential resource shortages or bottlenecks, interpreting the results, and identifying areas of improvement, taking steps to address any areas of concern
How can I create a histogram in Microsoft Excel?
To create a histogram in Microsoft Excel, first, input the data from a table or spreadsheet into the appropriate fields and select the “histogram” option.
Suggested articles:
- What Is Resource Loading And How Can It Help Your Project Management?
- 11 Free Resource Planning Templates
- Advantages of Resource Leveling vs Resource Smoothing
Shane Drumm, holding certifications in PMP®, PMI-ACP®, CSM, and LPM, is the author behind numerous articles featured here. Hailing from County Cork, Ireland, his expertise lies in implementing Agile methodologies with geographically dispersed teams for software development projects. In his leisure, he dedicates time to web development and Ironman triathlon training. Find out more about Shane on shanedrumm.com and please reach out and connect with Shane on LinkedIn.