
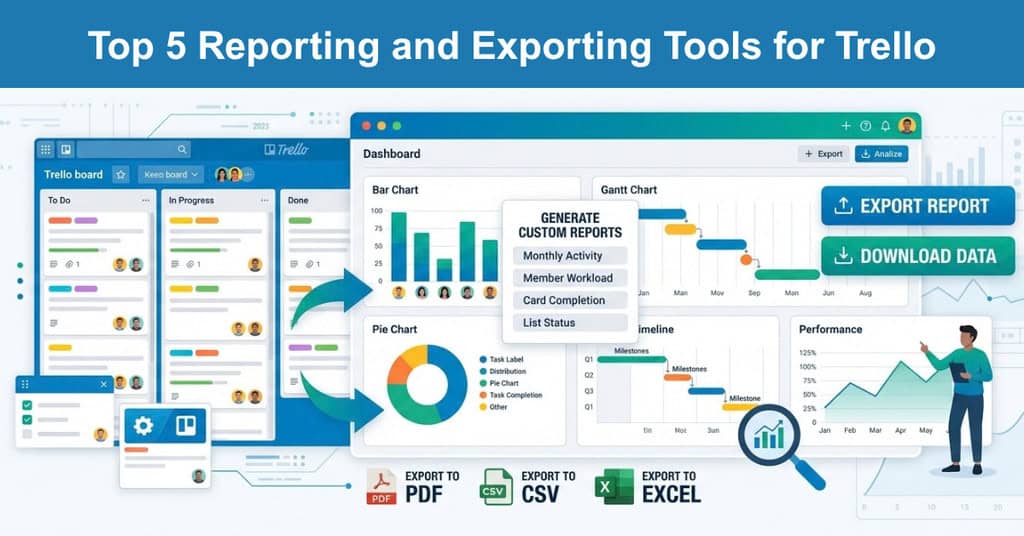
Trello makes planning work simple, but making sense of that work afterward is harder. VentureBeat reported that the Atlassian-owned platform had passed 50 million registered users, and many of those teams eventually need charts, burndowns, and spreadsheets that boards alone cannot produce. Without proper reporting, managers rebuild status updates by hand, export messy files, and guess at bottlenecks instead of measuring them with real data.
The gap is real and well documented. Native dashboards cover basic card counts, spreadsheet export sits behind a paid plan, and the free JSON export is difficult for most people to read. Third-party Power-Ups and companion apps close that gap with filtered exports, agile charts, timelines, and workload views. Here is what Trello offers natively, and which five tools deserve a place in your setup.
What Trello Offers Natively for Reporting and Exporting
Before adding a Power-Up, it helps to know what Trello already does. Premium Workspaces get Dashboard view, which charts cards by list, due date, member, and label, plus CSV export. Every plan can export JSON, and Atlassian describes the limits in its official data export documentation. Those built-in options are useful, but they stop short of the filtering and agile analytics most teams need.
Native reporting and export options currently work like this in practice:
- Dashboard View: Premium Workspaces can chart cards per list, due date, member, and label with bar or pie tiles, which suits quick status checks but not cycle time or burndown analysis.
- JSON Export: Any board member can export raw JSON, but it includes only the 1,000 most recent actions, so older comments disappear and the file is hard to read in spreadsheets.
- CSV Export: Premium Workspaces can download CSV files for spreadsheets, though archived cards are excluded by default and the file cannot be imported to rebuild a board.
The Best 5 Reporting and Exporting Tools for Trello
Trello has grown into one of the most widely used boards for planning work, yet it focuses mainly on its core features and leaves deeper reporting to partners. Its Power-Up directory fills that space with add-ons for charts, timelines, and exports. Below are five platforms that cover the reporting and exporting functions the native product does not provide, starting with the one we recommend most.
1. Bridge24 (Strongly Recommended)

Teams that need dependable Trello reports often start with Bridge24, which connects through a one-click, two-way link so edits appear in both apps instantly. Users pick predefined reports, group cards on two levels with custom fields, and produce printable output for stakeholders. It also offers a seven-day free trial, although the trial disables Excel and CSV export.
These capabilities explain why many reporting teams rely on it:
- Interactive Charts: Build pie, doughnut, polar, and bar charts from cards by member, list, label, or status, stack two variables in one chart, and export the chart with its card list to PDF.
- Export Engine: Export cards with comments, checklists, and custom fields to Excel, CSV, or PDF, choose only the columns you need, and pull card history from a specific period.
- Flexible Views: Switch between grid, calendar, and board layouts, apply advanced filters, sort and drill down, and add cards, attachments, or comments without leaving the Bridge24 workspace.
2. Planyway Team Planner
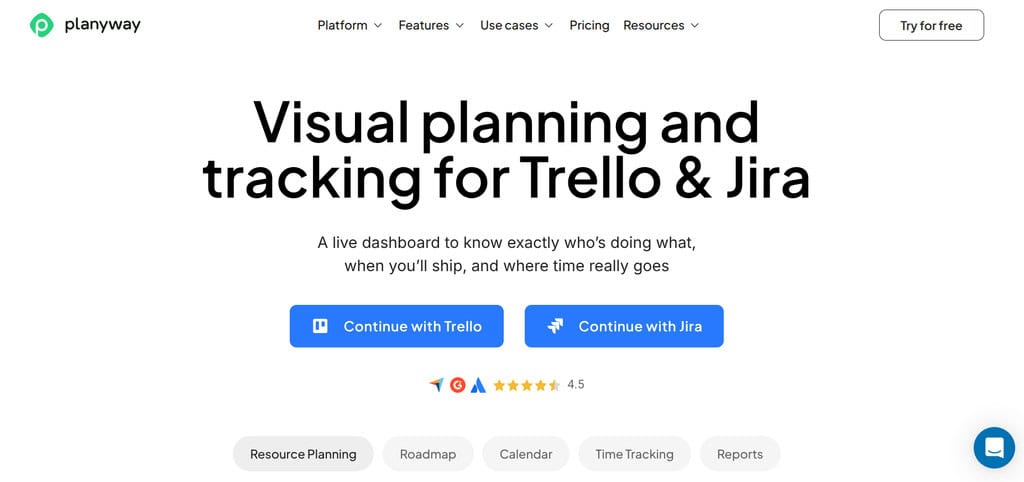
Planyway Team Planner runs inside Trello as a Power-Up that adds calendar, timeline, and workload views, so planners can see due dates and team capacity across several boards at once. The free plan covers calendar basics, while the paid Business plan starts at five dollars per user monthly and adds the timeline, time tracking, and exports. Teams use it to spot overload before deadlines slip.
Its planning and reporting features break down into three areas:
- Multi-Board Timeline: Combine several boards on one calendar or timeline, drag cards to reschedule them, and filter by member, label, or list to focus on the work that needs attention now.
- Workload Management: Compare each person’s assigned work against available hours, spot overloaded team members early, and confirm capacity before committing to a new roadmap, release, or sprint.
- Calendar and Data Export: Sync due dates with external calendars by URL on any plan, then use the paid Business plan to export Trello data to CSV or Excel for stakeholder reports and audits.
3. Corrello
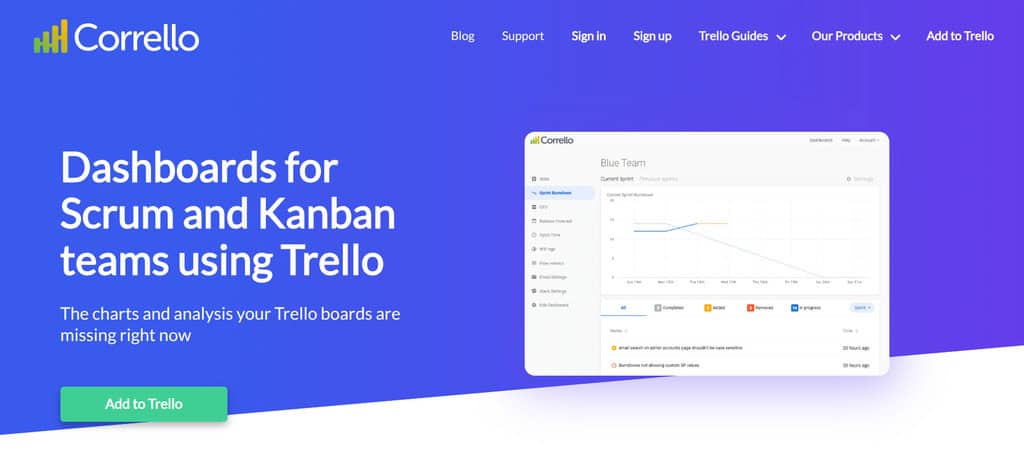
Corrello gives Scrum and Kanban teams the charts Trello lacks, including burndowns, cumulative flow diagrams, and cycle time statistics, without forcing a move to another platform. Pricing is five dollars per member monthly or 48 dollars per member annually, with a 14-day free trial. Observers are not counted toward billing, which keeps costs predictable on larger boards.
Agile teams typically get the most value from these chart types:
- Burndown Charts: Track remaining story points or cards each day against an ideal line, so teams see sprint drift early and adjust scope well before the review meeting.
- Cumulative Flow Diagrams: Show how many cards sit in each list over time, revealing bottlenecks where work piles up and helping Kanban teams smooth the flow of delivery.
- Cycle Time Statistics: Measure how long cards take from start to finish, flag slow-moving work, and forecast releases using historical delivery data instead of optimistic estimates, so planning stays realistic.
4. Blue Cat Reports
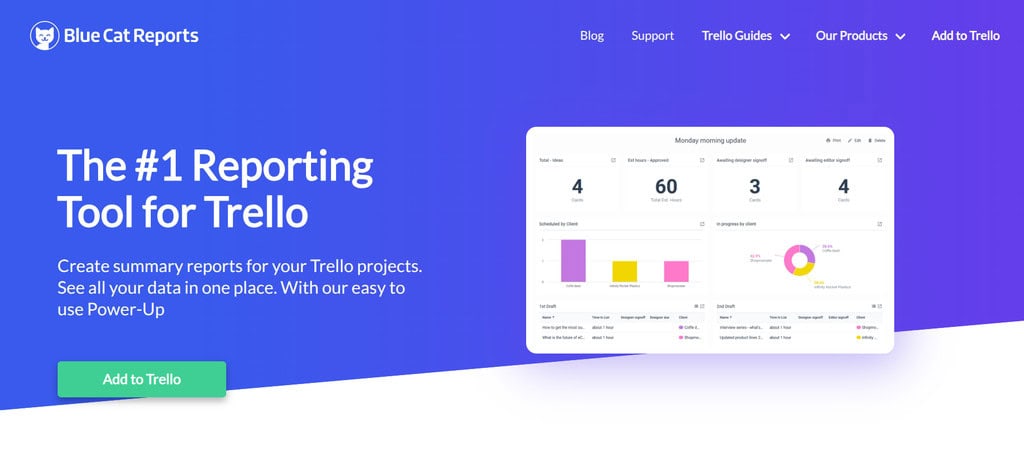
Blue Cat Reports pulls cards, checklists, custom fields, and user activity from several Trello boards into one customizable report builder. Teams can filter the data, chart it, and schedule daily, weekly, or monthly email reports for stakeholders. Pricing is four dollars per member monthly or 39 dollars annually, with a seven-day trial, and observers do not count toward billing.
Reporting and exporting needs are covered by these core capabilities:
- Custom Report Builder: Create dynamic reports and charts across multiple boards, filter by custom fields, and drill into cards, checklists, user activity, and time-to-complete metrics without any complicated setup.
- Scheduled Email Reports: Send regular daily, weekly, or monthly summaries to any organization member automatically, so stakeholders receive status updates without anyone assembling them by hand each week.
- CSV and Excel Export: A companion Export from Trello Power-Up downloads cards with custom fields to CSV or Excel, offering ten free exports and a paid plan for unlimited and scheduled exports.
5. Charts by Vizydrop
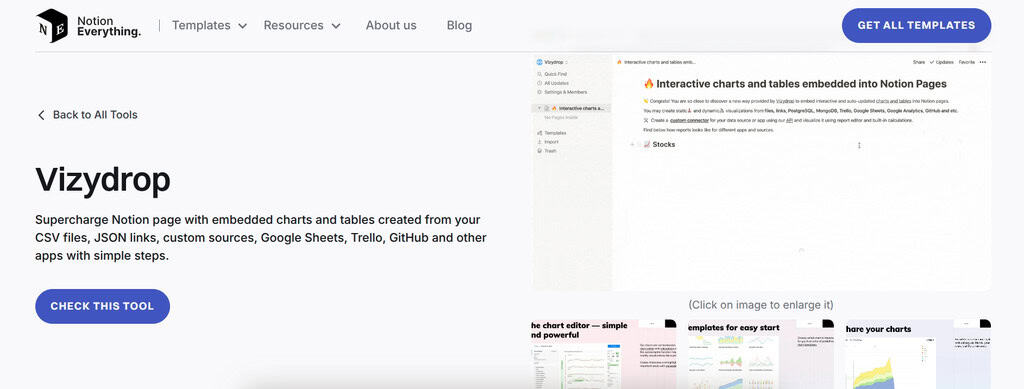
Charts by Vizydrop is a business intelligence Power-Up that turns board data into charts without spreadsheet work. A library of predefined templates covers common needs, and users can adjust any chart in the editor. The Power-Up has been free, but confirm current terms in the Trello directory before relying on it for ongoing reports. Charts can draw on several boards at once.
These features make Vizydrop especially useful for quick visual board analysis:
- Template Library: Start from predefined charts such as member card counts, list comparisons, and cards by label, then modify them rather than building every report from scratch.
- Multi-Board Analysis: Gather cards from several boards in one place, compare workloads across projects, and judge priorities with a single view instead of opening each board one by one.
- Flexible Data Sources: Build charts from tables, files, links, and other apps alongside Trello cards, so one report can combine project data with outside figures such as budgets or customer metrics.
How to Choose the Right Trello Reporting Tool
The right tool depends on who reads your reports and what decisions they support. Executives usually want clean exports and printable summaries, while delivery teams benefit from live charts and capacity views. Kanban teams in particular rely on visible workflow and work-in-progress limits, so flow-based charts matter more than card counts. Match the tool to the question you ask most often.
Use these checks to narrow the list before you start a trial:
- Report Audience: List who receives the reports, then confirm the tool outputs the format they need, whether that is PDF, Excel, a shared chart, or a live dashboard.
- Export Depth: Check whether comments, checklists, custom fields, and card history are included, since basic exports often leave those fields out and force hours of manual cleanup later.
- Pricing Model: Compare per-user, per-member, and per-board pricing against your team size, because the same tool can cost very different amounts for a team of five versus fifty.
- Trial Limits: Read what each trial includes, because some trials disable key features, such as Excel export, until you subscribe, which can hide serious gaps during testing.
For a quick side-by-side comparison, the table below summarizes all five tools, what each one is best suited for, and how much they cost.
| Tool | Best For | Pricing Note |
|---|---|---|
| Bridge24 | Filtered exports and printable reports | 7-day trial, paid per user afterward |
| Planyway Team Planner | Timelines, workload, and calendars | Free plan, paid from $5 per user monthly |
| Corrello | Burndown, flow, and cycle time charts | $5 per member monthly, 14-day trial |
| Blue Cat Reports | Scheduled reports and cross-board exports | $4 per member monthly, 7-day trial |
| Charts by Vizydrop | Quick charts across boards | Historically free, confirm terms |
Conclusion
Trello handles task tracking well, but serious reporting and exporting usually requires help. Native dashboards cover only basic counts, spreadsheet exports depend on a paid plan, and the free JSON file is limited and hard to read. Bridge24, Planyway, Corrello, Blue Cat Reports, and Charts by Vizydrop each fill a different gap, from printable exports and workload planning to agile charts and quick visual summaries.
The best choice depends on your audience, your workflow, and your budget. Start by naming the report your stakeholders request most often, confirm the specific export fields you need, and test one tool during its trial before rolling it out. With the right Power-Up in place, Trello becomes a reliable source of project insight, and your next status report takes only minutes instead of hours.
Frequently Asked Questions About Trello Reporting
Can you export a Trello board to Excel?
Trello does not export directly to Excel, but Premium Workspaces can download a CSV file that opens in any spreadsheet program. Free plans offer only JSON, which is hard to read. For richer output with comments, checklists, and custom fields, tools such as Bridge24 and Planyway provide filtered exports, though Bridge24 disables Excel export during its trial.
Does Trello have built-in reporting?
Yes, but it is basic. Premium Workspaces include Dashboard view, which charts cards per list, due date, member, and label using bar or pie tiles. There is no native burndown chart, cumulative flow diagram, or cycle time report, so agile teams usually add a Power-Up such as Corrello to measure sprint progress and workflow bottlenecks.
Which Trello Power-Up is best for agile charts?
Corrello is the strongest fit for Scrum and Kanban teams because it supplies burndown charts, cumulative flow diagrams, and cycle time statistics in one place. Pricing starts at five dollars per member monthly, with a 14-day trial. Teams wanting only a simple burndown can try lighter single-purpose options, but Corrello covers the widest range of agile metrics.
Are Trello reporting Power-Ups free?
Trello allows unlimited Power-Ups on every plan, but many third-party tools charge their own fees. Planyway has a free plan with paid upgrades, Bridge24, Corrello, and Blue Cat Reports offer free trials before subscriptions, and Charts by Vizydrop has historically been free. Always confirm current pricing in each Power-Up listing before you commit, because vendor plans can change without notice.
Why does Trello’s JSON export miss older comments?
Comments are stored as board actions, and Trello’s JSON export includes only the 1,000 most recent actions on a board. On busy boards, older comments and activity quickly fall outside that limit and disappear from the exported file, which surprises many teams. Dedicated export tools such as Bridge24 can include comments and card history in spreadsheet-ready files.
Suggested articles:
- Trello Export to Excel (Cards and Boards) with Bridge24
- The Pros and Cons of using Trello Software
- Top 5 Trello Gantt Chart Add-ons

Daniel Raymond, a project manager with over 20 years of experience, is the former CEO of a successful software company called Websystems. With a strong background in managing complex projects, he applied his expertise to develop AceProject.com and Bridge24.com, innovative project management tools designed to streamline processes and improve productivity. Throughout his career, Daniel has consistently demonstrated a commitment to excellence and a passion for empowering teams to achieve their goals.