
Project planning is all about clarity, control, and coordination. For Basecamp users, this just got a lot easier with Bridge24’s Basecamp Gantt Chart view integration, a game-changer for visualizing the progress of projects, to-dos, and cards in a more organized and structured manner. Whether you’re juggling multiple clients or streamlining internal workflows, Gantt charts help you map out every phase and stay on track with deliverables. The dynamic filtering option also allows users to tailor the Gantt chart view to their needs, ensuring they only see the corresponding projects, to-dos, and cards they want.
Here’s what you should know about this integration:
What Is the Gantt Chart View in Bridge24?
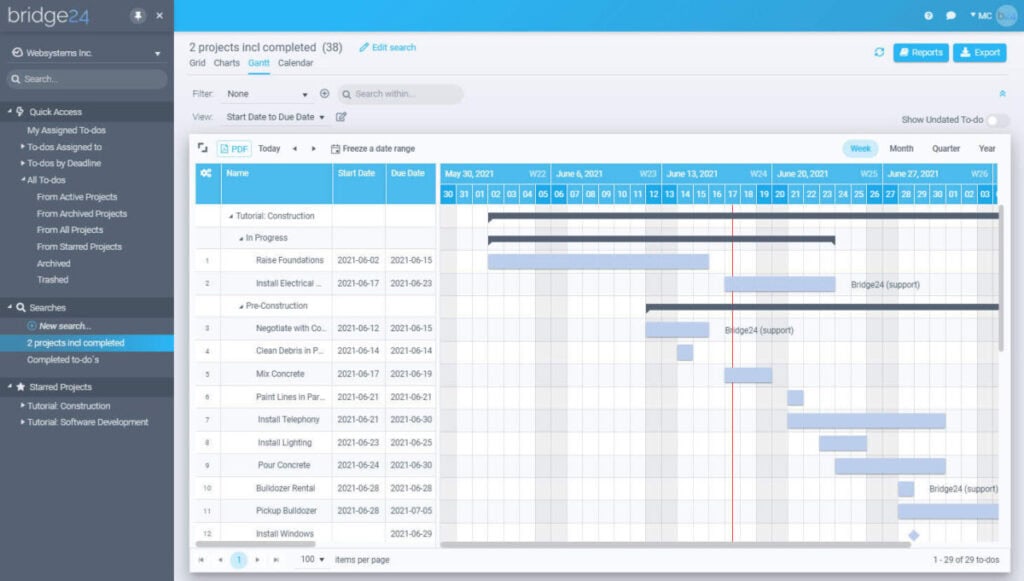
Bridge24 now offers a powerful Gantt chart view for Basecamp, allowing users to visualize all their to-dos and project tasks across multiple projects in one unified timeline. This integration makes it simple to plan, manage, and track tasks in a visual, calendar-style format. Rather than viewing project progress in static lists or cards, Gantt charts provide a dynamic timeline that shows how tasks unfold over time. You can see overlaps, dependencies, delays, and bottlenecks at a glance.
Key Features of the Bridge24 Gantt Chart for Basecamp
Here’s what sets this integration apart and why it’s ideal for project managers, team leaders, and Basecamp power users:
View Tasks Across All Projects
Bridge24’s Gantt view isn’t limited to just one project. It pulls data from all active Basecamp projects, allowing a unified view.
- See every to-do and card in a single timeline.
- Quickly identify tasks across multiple teams and clients.
- Improve cross-project resource allocation and scheduling.
Use Any Date Fields
Unlike rigid project management tools, Bridge24 allows you to customize which date fields define your timeline:

- Start and End Dates: Traditional task planning.
- Created At: Tseful for tracking task backlog or intake flow.
- Last Updated: Helpful for activity tracking or audit trails.
- Completed At: Monitor project close-out and delivery dates.
You can easily configure this from the Edit Gantt View > Setup Tab.
Drag-and-Drop Task Rescheduling
Need to shift timelines on the fly? No problem.
- Simply drag and drop the task bar to adjust start or end dates.
- Real-time syncing ensures changes reflect immediately.
- Great for agile or dynamic teams that often re-prioritize.
Group and Collapse by Project or List
Gantt charts can get busy, especially when managing multiple projects. Bridge24 offers collapsible grouping:
- Group by Project: For high-level visibility.
- Group by List (or To-Do Set): For task-focused planning.
This structure helps you toggle between macro and micro perspectives with ease.
Display Tasks Without Dates
Don’t let undated tasks slip through the cracks.
- Undated tasks appear visually in a separate section.
- Quickly drag them into the timeline to schedule them.
- Ensures nothing gets forgotten or left behind.
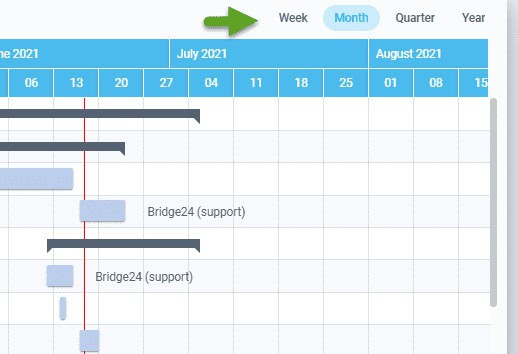
Adjustable Timescales for Better Planning
One of the most practical features is the ability to change the timescale depending on your planning horizon:
Weekly View
Ideal for sprint planning or short-term deliverables.
- Track task overlap and assignments for the current week.
- Monitor resource utilization and focus areas.
Monthly View
Perfect for managing monthly campaigns or project milestones.
- Spot bottlenecks and dependencies.
- Plan deadlines and team workloads ahead of time.
Quarterly & Yearly Views
Get a bird’s eye view of long-term initiatives.
- See all your launches, phases, or client projects across the year.
- Use it for executive reporting or roadmap presentations.
To change the timescale, simply select your preferred interval from the top-right corner of the Gantt chart view.
Real-World Benefits of Using the Bridge24 Gantt Chart
Here’s how this integration transforms your Basecamp experience:
Enhanced Visibility
With everything mapped visually, it’s easier to track:
- What’s due soon
- What’s running late
- What overlaps or conflicts with other tasks
Improved Team Alignment
Everyone on the team can see how their tasks connect to the bigger picture.
- Reduces silos and miscommunication.
- Encourages ownership and accountability.
Faster Decision-Making
Need to move a deadline or assign a task?
- No need to bounce between screens or apps.
- Instantly adjust timelines and reallocate workloads.
Export for Reporting
Need to present project timelines to clients or stakeholders?
- Export the entire Gantt chart as a PDF with one click.
Great for reports, presentations, and documentation.
How to Get Started with Bridge24’s Gantt Chart View
If you’re new to Bridge24 or want to explore the Gantt chart functionality, here’s a quick start guide:
- Connect Your Basecamp Account: Sign in to Bridge24.com and authorize Basecamp to sync your data securely.
- Select the Gantt Chart View: From the left sidebar, choose the Gantt Chart under “Views”.
- Customize Date Fields: Go to the Edit Gantt View, then choose which fields represent the start and end of each task.
- Filter and Group: Use filters to narrow by project, assignee, or task status, then group tasks by project or list for clearer context.
- Interact with the Chart: Drag to move tasks and click any task to edit details, assign users, or change status.
What’s New in 2025?
Bridge24 has continued to enhance its Gantt view in 2025 with new updates to improve usability:
- Auto-Snap to Dates: Tasks now snap to weekdays for cleaner scheduling.
- Color Coding by Status: Instantly see what’s open, in progress, or completed.
Keyboard Shortcuts: For power users who want to navigate faster. - Mobile Responsiveness: View your Gantt charts on tablets and mobile devices with improved UI.
These updates make Bridge24 not just a Basecamp add-on, but a productivity hub for managing teams and timelines with confidence.
Final Thoughts: A Must-Have Tool for Basecamp Users
The Gantt chart integration from Bridge24 is a much-needed visual planning tool that fills one of Basecamp’s biggest gaps. It allows users to organize, schedule, and adjust tasks across projects in an intuitive and flexible way. With features like dynamic filters, custom date fields, collapsible views, and PDF exports, it’s a powerful tool for any team aiming to work smarter, not harder.
Additionally, the integration of the Gantt chart feature in Basecamp has been well-received by users, who appreciate having a more complete and intuitive view of their projects. Overall, Bridge24’s Gantt chart integration for Basecamp is a significant step forward, providing users with the tools they need to manage their projects more effectively and efficiently.
Suggested articles:
- Basecamp – Export your Projects to Excel or CSV
- Basecamp – Export Cards and To-dos to Excel or CSV
- Asana vs Basecamp vs Trello Comparison
Daniel Raymond, a project manager with over 20 years of experience, is the former CEO of a successful software company called Websystems. With a strong background in managing complex projects, he applied his expertise to develop AceProject.com and Bridge24.com, innovative project management tools designed to streamline processes and improve productivity. Throughout his career, Daniel has consistently demonstrated a commitment to excellence and a passion for empowering teams to achieve their goals.