In this Atlassian Confluence tutorial, you’ll learn how to build a project status dashboard in 3 easy steps.
Atlassian’s Confluence is a powerful and flexible collaboration platform designed to help distributed teams work more effectively and deliver better software products. As a centralised workspace, Confluence enables teams to organise information, create and manage documents, and collaborate on project work — all in one place. Project teams can leverage Confluence to develop comprehensive product documentation, maintain meeting minutes, design process flow diagrams and mind maps, and produce detailed technical architecture documents. In this article, I will walk you through the steps to build a project portfolio dashboard that provides clear visibility across your projects or programmes.
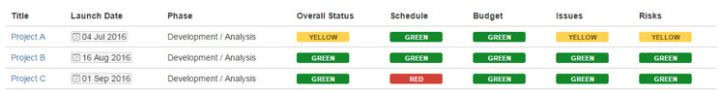
Below is a sample snapshot of a small program with 3 projects. Using Atlassian’s Confluence graphical indicators, I can assess each project’s health in terms of status, schedule, budget, issues, and risks with one glance.
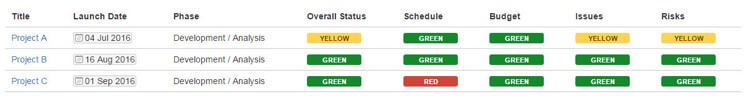
If I click on the project title, I can drill down to the specific status report for further analysis. The benefit of this solution is that program managers can roll up individual status reports into summary-level reports. If the underlying status report changes, the dashboard is automatically updated.
Step 1: Create Individual Status Reports
Each project in your portfolio needs its own dedicated status report page in Confluence. These pages serve as the data source for the portfolio dashboard, so consistency in structure and labelling is critical from the outset. The fields you include should reflect your organisation’s existing reporting standards, covering areas such as overall status, schedule, budget, issues, and risks. Confluence is flexible enough to accommodate nearly any status template format.
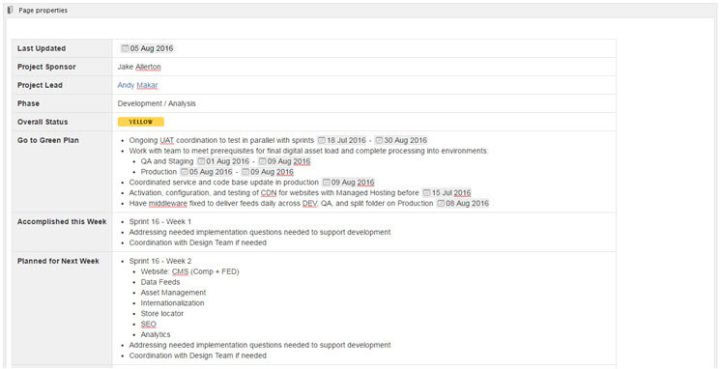
Step 1.1: Create a Table in Confluence and Format Using the Heading Column Icon

Begin by creating a new Confluence page for the first project and inserting a table that mirrors your standard project status report template. Use the heading column icon in the table toolbar to distinguish your label column from the value column. You can enter text directly into cells, use the @ shortcut to tag team members, and use the // shortcut to insert dates quickly.
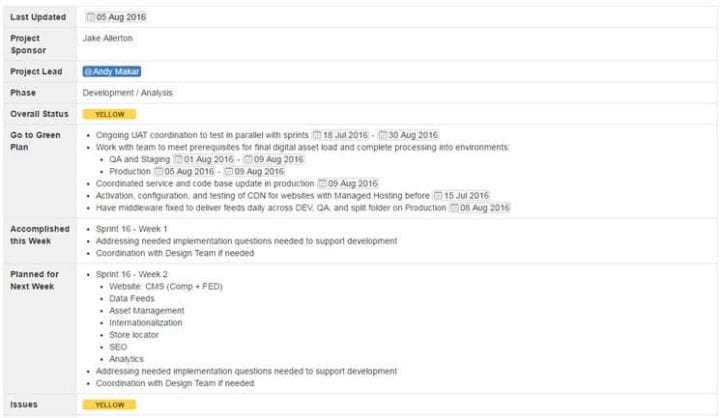
Below is the sample status report.
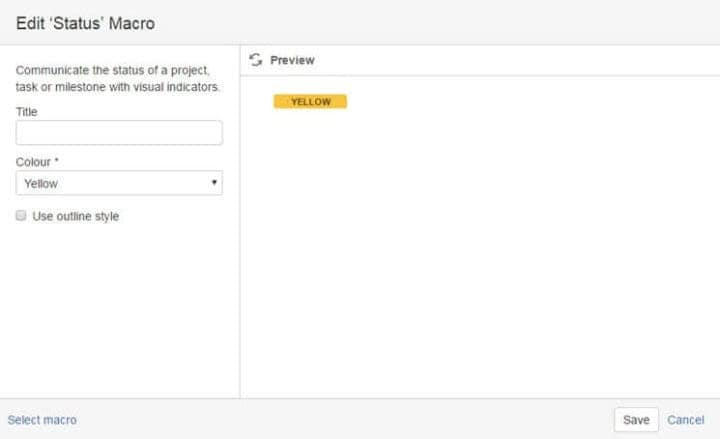
Step 1.2: Add Status Indicators Using the Status Macro
Once your table is in place, you can add colour-coded traffic light indicators to key fields. Click the Insert Macro icon in the toolbar and search for the Status macro. Format each status indicator with your preferred label text and colour, using green, amber, or red to communicate health at a glance.
Step 1.3: Insert a Page Properties Container
The Page Properties macro is the technical backbone of the entire dashboard solution. Insert the macro below your status report table. It is fine if it appears outside the table at this stage, as you will be relocating the table into the container in the next step.

Step 1.4: Cut and Paste the Table Into the Page Properties Container
Select the entire status report table and paste it inside the Page Properties macro container. This step is what allows the portfolio-level report to read and display the data from each status page. Verify that the table renders correctly inside the container before proceeding.
Step 1.5: Add a Label Called “Status” to the Page
Labels are the mechanism that connects individual status pages to the portfolio dashboard. With the page in edit mode, click the tag icon next to the page title to open the label dialogue.

If you are not in edit mode, pressing “L” on your keyboard will open the same dialogue box.
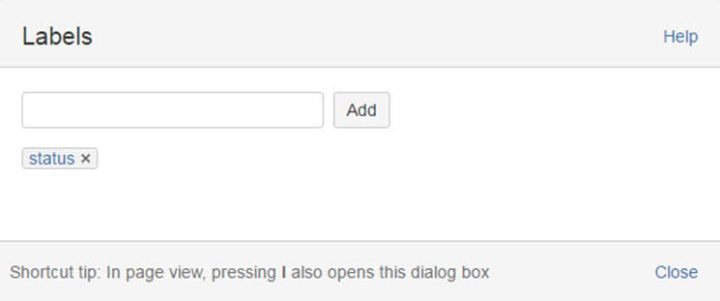
Step 1.6: Enter the Word “Status” for the Label, Press Add, Close the Dialog Box, and Save the Page
Saving the label correctly is essential, as the portfolio macro will filter pages based on this exact label. Once saved, you have completed your first fully functional status report template. If you plan to roll this out across your organisation, consider creating a global page template in Confluence so that other teams can adopt the same structure without starting from scratch.
Step 1.7: Repeat Creating Status Reports for Every Workstream or Project in the Programme or Portfolio
After completing the first status report, the remaining pages become a straightforward copy-and-paste exercise. Duplicate the page, update the project-specific fields, and confirm that each page carries the “status” label. Maintaining this consistency across all pages ensures the portfolio dashboard populates accurately and completely.
Step 2: Create the Portfolio Page
With individual status report pages in place, the next step is building the summary view that pulls everything together. This portfolio page uses the Page Properties Report macro to automatically aggregate data from every labelled status page into a single, scannable table. The key benefit of this approach is that any update made to an individual status report is immediately reflected in the portfolio view, without any manual intervention.
Step 2.1: Insert a Page Properties Report Macro
Create a new Confluence page to serve as your portfolio dashboard and insert the Page Properties Report macro. This macro works by scanning your Confluence space for pages that contain both the Page Properties macro and a specified label, then displaying their content as a consolidated table with links to each source page.
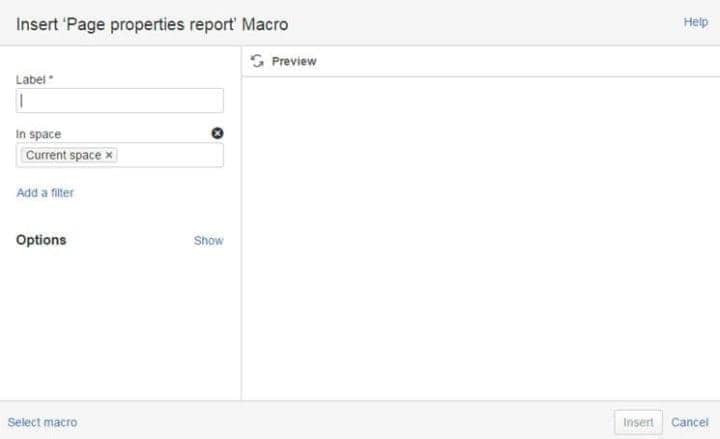
Step 2.2: Enter the Label “Status”
In the macro configuration dialogue, enter “status” as the label filter. This tells the macro which pages to include in the report. Only pages tagged with this exact label will appear in the dashboard, so consistent labelling across all status report pages is critical.
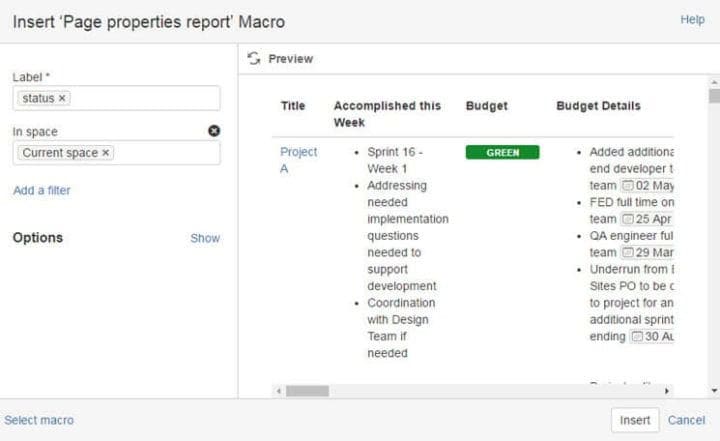
Step 2.3: Click Options and Enter the Following Columns: Launch Date, Phase, Overall Status, Schedule, Budget, Issues, Risks
Limiting the columns displayed keeps the dashboard focused and readable. You can also set a numeric limit on the number of rows displayed and configure the report to sort by launch date, giving programme managers an immediately prioritised view of the portfolio. Click the Preview icon to verify the output before saving.
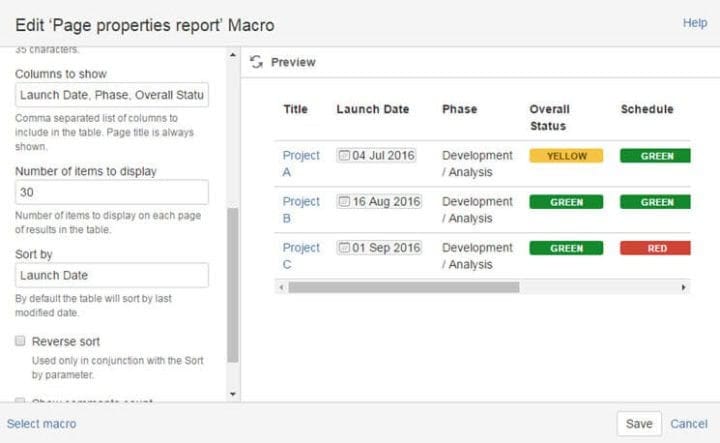
Step 2.4: Click Save to Close the Dialogue and Save the Page
Saving the page locks in your macro configuration and renders the live dashboard. From this point forward, any changes to the individual status report pages will automatically update the portfolio view. No manual refresh or re-export is required.
Step 3: Review the Completed Dashboard
With the Page Properties Report macro configured and saved, your portfolio dashboard is fully operational. The table displays each project as a row, with colour-coded status indicators providing an at-a-glance view of health across schedule, budget, issues, and risks. Clicking any project name links directly to the corresponding status report for a deeper review.
The practical value of this setup becomes clear at scale. Program managers overseeing large portfolios, such as a PMO tracking 60 or more active projects each week, can eliminate the time-consuming process of consolidating separate PowerPoint decks or chasing updated files via email. Real-time visibility into every project’s status, available in a single Confluence page, transforms how teams report and respond to change.
Confluence: The AI Workspace That Works With You
Confluence is no longer simply a wiki or document repository. It is a unified workspace where human and AI teammates collaborate across every content type, from live documents and whiteboards to databases, slides, and video, all within a single platform. Atlassian’s Rovo AI is embedded throughout the experience, helping teams beat the blank page, surface relevant knowledge instantly, and move work forward without manual overhead.
The platform is built around four core capabilities that distinguish it from traditional collaboration tools. Here is how Confluence supports every stage of your team’s work:
- AI Content Creation: Confluence uses Rovo AI to help teams draft documents instantly from a prompt, including PRDs, project briefs, annual plans, and meeting notes, using ready-to-use templates that eliminate the friction of starting from scratch.
- Rovo Remix: This feature allows users to transform existing content into timelines, charts, maps, and slides, making complex ideas easier to communicate to different audiences without recreating assets from the ground up.
- AI Search and Answers: Confluence’s intelligent search draws on content across your entire workspace, connected tools, and integrations to surface accurate answers in a fraction of the time that manual searching would require.
- AI Summaries and Briefings: Teams stay current through AI-generated page and comment summaries, audio briefings, and smart notifications that surface only the most relevant updates, reducing time spent on status-chasing.
Confluence also introduces the Teamwork Graph, a capability that links teams, work items, and goals to unlock contextual awareness directly within the flow of work. Rather than navigating between disconnected tools, teams gain a joined-up view of how individual contributions connect to broader organisational outcomes. This makes Confluence particularly effective for programme managers who need to align multiple workstreams under a common strategic goal.
Real-World Results: The Business Impact of Confluence
The results across organisations using Confluence reflect this shift in how teams operate.
- Royal Caribbean reports saving over 800 hours and $500,000 per year by replacing manual reporting with automated Jira and Confluence workflows.
- Lumen credits the platform with helping their teams reduce cycle time and increase throughput by 200%, delivering capabilities to customers faster and improving satisfaction scores.
These outcomes are a direct reflection of a platform engineered to eliminate administrative overhead and maintain a sharp focus on delivery. For programme managers and PMO teams ready to harness these capabilities, the steps outlined above provide a practical, step-by-step guide to building a live project status dashboard using Confluence’s Page Properties macro and labelling system.
Conclusion
Building a project portfolio dashboard in Confluence is a straightforward process that delivers immediate, lasting value for programme managers and PMO teams. By combining the Page Properties macro with consistent labelling and a structured status report template, you create a self-updating system that reflects the current state of every project without manual consolidation. The result is a more efficient reporting workflow and sharper decision-making across the portfolio.
As your portfolio grows, this solution scales with it. Adding new projects requires only duplicating an existing status report, updating the relevant fields, and applying the correct label. For teams ready to move beyond static status updates, this Confluence setup offers a reliable foundation for real-time programme visibility and more confident stakeholder communication.
FAQs
What is the Page Properties macro in Confluence?
The Page Properties macro is a Confluence feature that wraps a table of data on an individual page, making that data readable by the Page Properties Report macro on a separate summary page. It is the core mechanism that enables the portfolio dashboard to pull and display information from multiple status report pages automatically.
Do I need admin access to set up this dashboard?
You do not need full admin access to build this solution, but you will need edit permissions for the Confluence space where your status report pages and portfolio page are stored. If you plan to create a global page template so other teams can reuse the status report format, you will need Confluence admin rights for that specific step.
Can I include projects from different Confluence spaces in one dashboard?
Yes, the Page Properties Report macro can pull data from pages across multiple Confluence spaces, not just the space where the portfolio page lives. This makes it possible to build a single executive-level dashboard that aggregates status reports maintained by different teams in separate spaces, as long as all pages use the same label.
What happens to the dashboard when a status report is updated?
The dashboard updates automatically whenever an individual status report is saved. Because the Page Properties Report macro reads data directly from the source pages, there is no need to refresh or reconfigure the portfolio page manually. This real-time synchronisation is one of the primary advantages of this approach over static, file-based reporting methods.
Can I add more fields to the portfolio dashboard beyond the default columns?
Yes, you can display any field from the status report table in the portfolio dashboard simply by adding the corresponding field name to the column list in the Page Properties Report macro settings. This flexibility allows you to customise the dashboard to match your organisation’s specific reporting requirements without rebuilding the underlying structure.
Suggested articles:
- Atlassian Confluence Tutorial: Track a List of Action Items
- Top 10 Cons & Disadvantages of Using Confluence
- Atlassian Confluence for Project Management
Andrew Makar, DMIT, PMP, CSM is an IT director with delivery experience across projects, programs and portfolios in Digital Marketing, Automotive, Software and Financial Management industries. He is an enthusiastic leader who effectively translates project management theory into practical application. His area of interest and practice is in implementing Agile processes and SCRUM techniques to deliver better software to his customers. Find out more about Andrew on andymakar.com and please reach out and connect with Andrew on LinkedIn.