Managing personnel across a large facility presents unique challenges, particularly when resources are being actively reduced over time. Microsoft Project, now evolved into Microsoft Planner as part of the Microsoft 365 suite, offers a structured, visual approach to tracking headcount and resource allocation in ways that spreadsheets simply cannot match. Whether you are overseeing a corporate restructuring or a government base closure, understanding how to model resource drawdown accurately is an essential project management capability.
This article walks through a practical resource management model built in Microsoft Project, now Microsoft Planner. Developed in response to a query from a United States Central Command employee tracking personnel during a military base closure, the model demonstrates how to monitor total headcount at any given time and visualise the resource ramp-down as units deactivate. Follow each step to build a working model for your own scenario.
A Note on Microsoft Project and Microsoft Planner
Before diving into the model, it is worth clarifying the current product landscape for those planning new implementations. Microsoft has transitioned its project management offerings under the unified Microsoft Planner brand, accessible through Microsoft 365. The cloud-based capabilities formerly known as Project for the web are now part of Planner, with tiered plans ranging from the free Microsoft 365 inclusion up to the Planner and Project Plan 3 licence at $30 per user per month.
For users who require the advanced desktop scheduling capabilities used in this article, the Microsoft Project desktop client remains available. It is included in the Planner and Project Plan 3 subscription, which also covers programme management, resource requests, and advanced dependencies. If you are configuring a new resource management environment, it is worth reviewing the current Planner plans to determine which tier best suits your organisation’s needs before replicating this model.
Develop the WBS
The foundation of any Microsoft Project resource model is a well-structured work breakdown structure. Before entering data into the software, it helps to think visually about the hierarchy you are trying to represent. Using a mind-mapping tool such as Matchware MindView allows you to sketch the structure clearly before exporting it into Microsoft Project for further development.
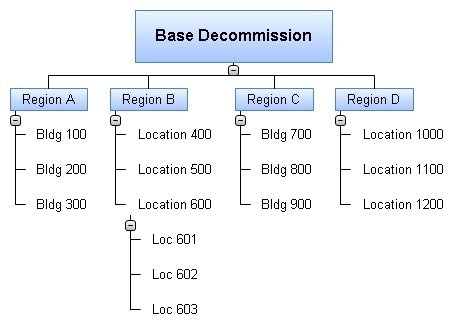
Figure 1 – Work Breakdown Structure
In this example, the base forms the top-level WBS deliverable, divided into regions, then individual buildings, and finally specific floors. The term “location” can substitute for buildings where resources are assigned to an ambiguous sub-region rather than a defined structure. The level of detail can extend as far as individual offices or workstation positions, depending on the precision required by your reporting needs.
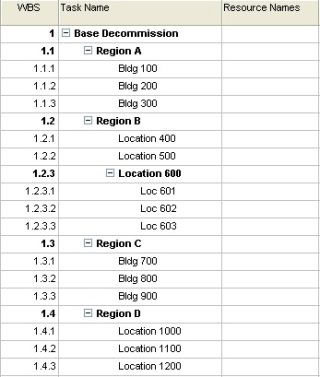
Figure 2 – WBS in Microsoft Project
Set the Project Start Date
Before assigning resources or durations, you must confirm that Microsoft Project is anchored to the correct timeline. An accurate start date ensures that all task durations and finish dates align with real-world decommission milestones. To set the project start date, navigate to Project, then Project Information, and select the desired start date from the drop-down menu.
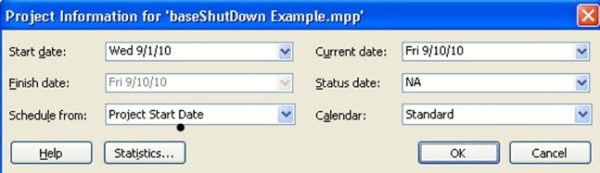
Figure 3 – Project Start Date Base Shutdown
Define the Resource Pool
With the project timeline established, the next step is populating the resource pool with all personnel currently on site. For large facilities with hundreds or thousands of staff, importing resources from an Excel extract of an existing resource management system is the most efficient approach. The steps below walk through configuring the resource sheet correctly:
Here are the steps to follow in the correct order:
- Go to View, then Resource Sheet.
- Right-click the following columns and select Hide: Type, Material Label, Max Units, Standard Rate, Ovt. Rate, Accrue At, and Code.
- Enter each person’s name in the Resource Name column and their team name in the Group column.
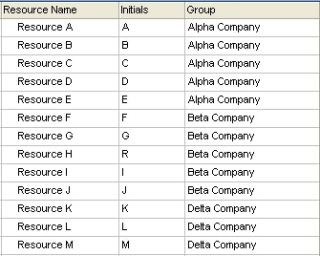
Figure 4 – Resource Pool Definition
Hiding unnecessary columns reduces visual clutter and keeps the sheet focused on the data points relevant to personnel tracking. The Group column is particularly useful when you need to filter and report on specific teams or units later in the model.
Assign Resources to Locations
Once the resource pool is defined, each person must be linked to a specific building or location within the WBS. This assignment is what allows Microsoft Project to track which personnel are tied to which areas of the facility. You can assign resources by selecting names directly from the Resource Name column in the Gantt Chart view, or by using the Assign Resource dialog box, accessed by clicking the task and pressing Alt and F10 simultaneously.

Figure 5 – Resource Assignment
Assign Location to Decommission Dates
Resource assignments alone do not produce a meaningful ramp-down model. Each location must also be given a target decommission date so the schedule reflects the actual drawdown timeline. If a building has no dependencies, a straightforward finish date is sufficient. Where buildings must be vacated in a specific sequence, task predecessors can be used to enforce that order.
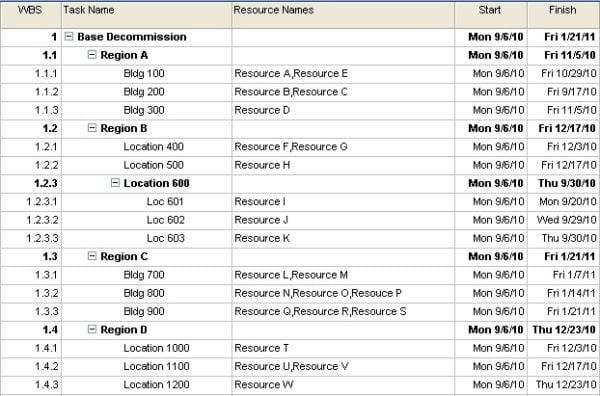
Figure 6 – Basecamp Decommission Schedule
It is assumed that all resources are assigned to their respective buildings at the project start date, meaning every task shares the same start date. Selecting the decommission date for each task populates the Finish date automatically, producing a completed schedule that reflects the phased closure of each location across the facility.
Set Up the Resource Graph
The resource graph transforms the schedule data into a visual curve that shows headcount over time. Configuring this graph correctly is essential for stakeholders who need to monitor total personnel levels at a glance. Follow these steps to set up the view:
The following steps configure the resource graph for accurate visual output:
- Go to View, then Resource Sheet.
- Go to Window, then Split.
- Click the lower window pane and select View, then Resource Chart.
- Right-click the Resource Graph and select Peak Units Graph.
- Right-click the Resource Graph and select Bar Styles.
- Under the Selected Resources section on the left, change the Overallocated and Allocated Resources “Show As” options to Area.
- Under the Resource section on the right, change the Overallocated and Allocated Resources “Show As” options to Don’t Show.
- Confirm the options match the Bar Style reference image and click OK.

Figure 7 – Bar style options
Switching the graph display to Area mode makes the personnel count visually intuitive, clearly showing the slope of the drawdown rather than presenting isolated data points. This format is far easier for non-technical stakeholders to interpret in briefings and status reports.
View the Resource Management Model
With the configuration complete, the resource graph becomes a live view of personnel levels across the full project timeline. Clicking the magnifying glass in the lower resource graph pane adjusts the time scale, allowing you to zoom in on specific phases of the closure. Selecting multiple resources in the upper pane simultaneously displays the allocation curve for each individual or team in the model.

Figure 8 – Completed Resource Management Model
In this example, the horizontal axis of the resource curve shows the resource count over five months. The model begins with 23 resources and reduces to zero as the base reaches full closure. The horizontal line at the top of the graph marks the original resource level at the project start. By adding further resources and filtering by team name, project managers can display individual, team-level, and full resource pool curves within the same interface.
Conclusion
Microsoft Project provides a structured and visual method for tracking resource drawdown that goes well beyond what a simple spreadsheet can offer. By combining a detailed WBS with resource assignments, decommission dates, and a configured resource graph, project managers can monitor personnel levels with precision and communicate progress clearly to stakeholders at every stage of a closure or restructuring effort.
The model outlined in this article is adaptable well beyond military base closures. Any scenario involving a planned reduction of personnel across multiple locations, whether a facility shutdown, a phased office consolidation, or a programme wind-down, can benefit from this approach. With Microsoft’s project management capabilities now unified under the Microsoft Planner brand, teams have more flexible options than ever for implementing resource management at scale.
FAQs
What is the difference between Microsoft Project and Microsoft Planner?
Microsoft Planner is now the unified brand for Microsoft’s work and project management tools within Microsoft 365. The cloud-based scheduling capabilities formerly known as Project for the web have been folded into Planner’s tiered plans. The Microsoft Project desktop client remains available for advanced scheduling needs and is included in the Planner and Project Plan 3 subscription at $30 per user per month.
What is resource management in Microsoft Project?
Resource management in Microsoft Project refers to the process of assigning people, equipment, or materials to project tasks and tracking their allocation over time. The tool allows project managers to monitor workloads, identify overallocations, and visualise how resource levels change across the project timeline using built-in views such as the Resource Graph and Resource Sheet.
How do I import resources into Microsoft Project from Excel?
To import resources from Excel, prepare a spreadsheet with columns that match Microsoft Project’s resource fields, such as name and group. You can then use the import wizard under File to map your spreadsheet columns to the corresponding fields in the resource sheet. This approach is recommended when managing large resource pools of several hundred or more personnel.
Can Microsoft Project track resource drawdown over time?
Yes. By assigning resources to tasks with specific start and finish dates, Microsoft Project can display how total resource levels change across the project duration. The Resource Graph view, configured to show Peak Units as an area chart, produces a clear visual curve that illustrates the rate of reduction over time.
When should I use task predecessors instead of fixed finish dates?
Task predecessors should be used when the completion of one location or phase must occur before another can begin. In a base closure scenario, if a building cannot be vacated until another has been fully cleared, a predecessor relationship enforces that sequence in the schedule. For independent locations with no dependencies, a fixed finish date is simpler and sufficient.
Suggested articles:
- Microsoft Project Tutorial: How to Track Percent Complete
- Finding Late Tasks with Microsoft Project Custom Filters
- How to Calculate Earned Value in Microsoft Project
Andrew Makar, DMIT, PMP, CSM is an IT director with delivery experience across projects, programs and portfolios in Digital Marketing, Automotive, Software and Financial Management industries. He is an enthusiastic leader who effectively translates project management theory into practical application. His area of interest and practice is in implementing Agile processes and SCRUM techniques to deliver better software to his customers. Find out more about Andrew on andymakar.com and please reach out and connect with Andrew on LinkedIn.