Earned Value Management (EVM) is one of the most objective and reliable methods for assessing project performance. By integrating scope, schedule, and cost into a single measurement framework, it gives project managers a factual picture of whether a project is on track, ahead, or falling behind. Microsoft Project Desktop remains one of the most widely used tools for performing these calculations, offering built-in earned value views, reports, and indices that remove much of the manual math from the process.
This guide walks through six essential steps for setting up and calculating earned value in Microsoft Project Desktop, with context on how the Microsoft project management landscape has evolved.
The Microsoft Project Ecosystem in 2025 and Beyond
Before diving into the steps, it is worth acknowledging how the Microsoft project management landscape has shifted. In August 2025, Microsoft retired Project for the web, along with the Project and Roadmap apps in Microsoft Teams, redirecting users to Microsoft Planner for the web and Planner in Teams as the two platforms merged. With a premium Planner license, users can now access familiar capabilities such as baselines, advanced dependencies with lead and lag, goals, sprints, and task history, along with AI-powered tools including Copilot and the Project Manager agent.
Microsoft Project Desktop is a sophisticated tool designed for large projects led by skilled project managers, suited for industrial-sized applications and corporations. For those working with the Microsoft Project desktop client, Project Professional 2021, or Project Standard 2024, the earned value workflow described below remains fully applicable. The steps also translate conceptually to Planner Premium for teams leveraging the unified platform.
Step 1: Enter Resources in the Resource Sheet View
The Resource Sheet view is where project managers define all the people and equipment contributing to a project. Microsoft Project distinguishes between work resources, which are the people and equipment that consume time to complete tasks, and material resources, which are consumable supplies such as concrete or hardware components. Most software and knowledge-work projects rely almost exclusively on work resources, each assigned a standard hourly cost rate.
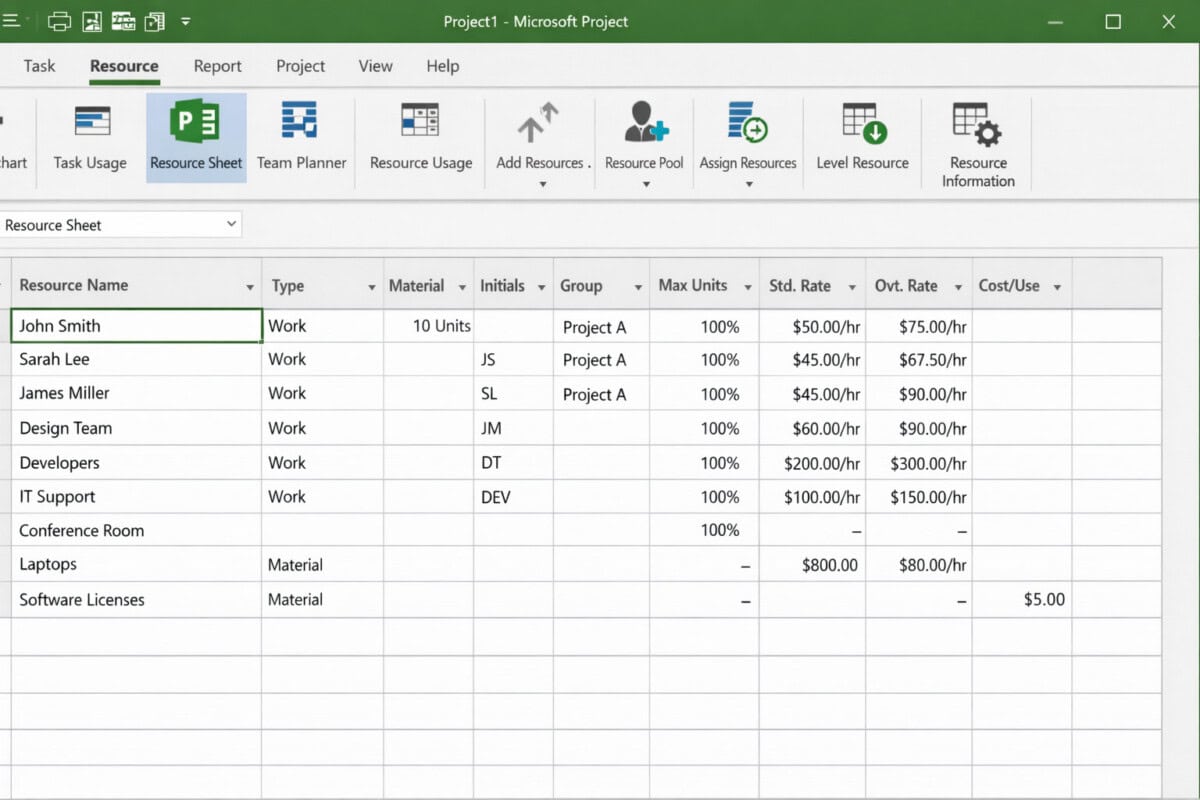
Entering accurate cost rates at this stage is essential because these figures form the basis for calculating Planned Value (PV), also known as Budgeted Cost of Work Scheduled (BCWS). If a resource, such as a client stakeholder, is not billable to the project, assigning a rate of $0.00 is appropriate. For internal IT projects that need to track both IT and functional resource costs, each team member should be assigned a standard rate that reflects their true cost to the organization.
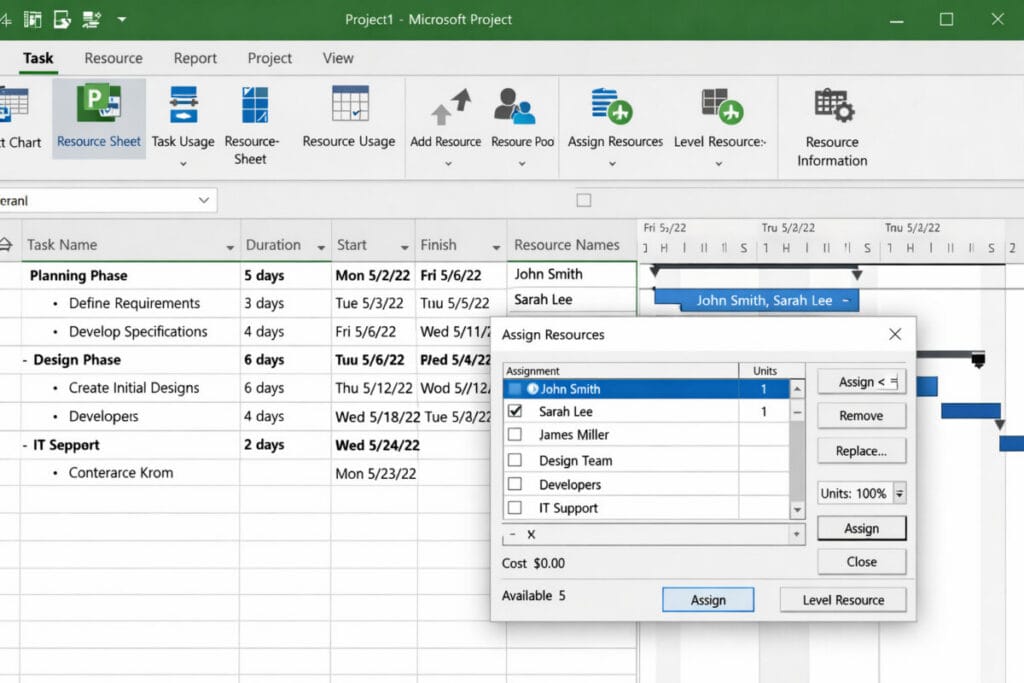
Step 2: Assign Resources to Tasks
After establishing your pool of resources and their costs, the next step is to assign those resources to all tasks in the Gantt Entry view. The most direct approach is to use the Assign Resources dialog, accessible through the Resource Management toolbar, which allows project managers to map specific people to individual tasks. Microsoft Project automatically calculates the cost of each task as soon as resource assignments and hourly rates are in place.
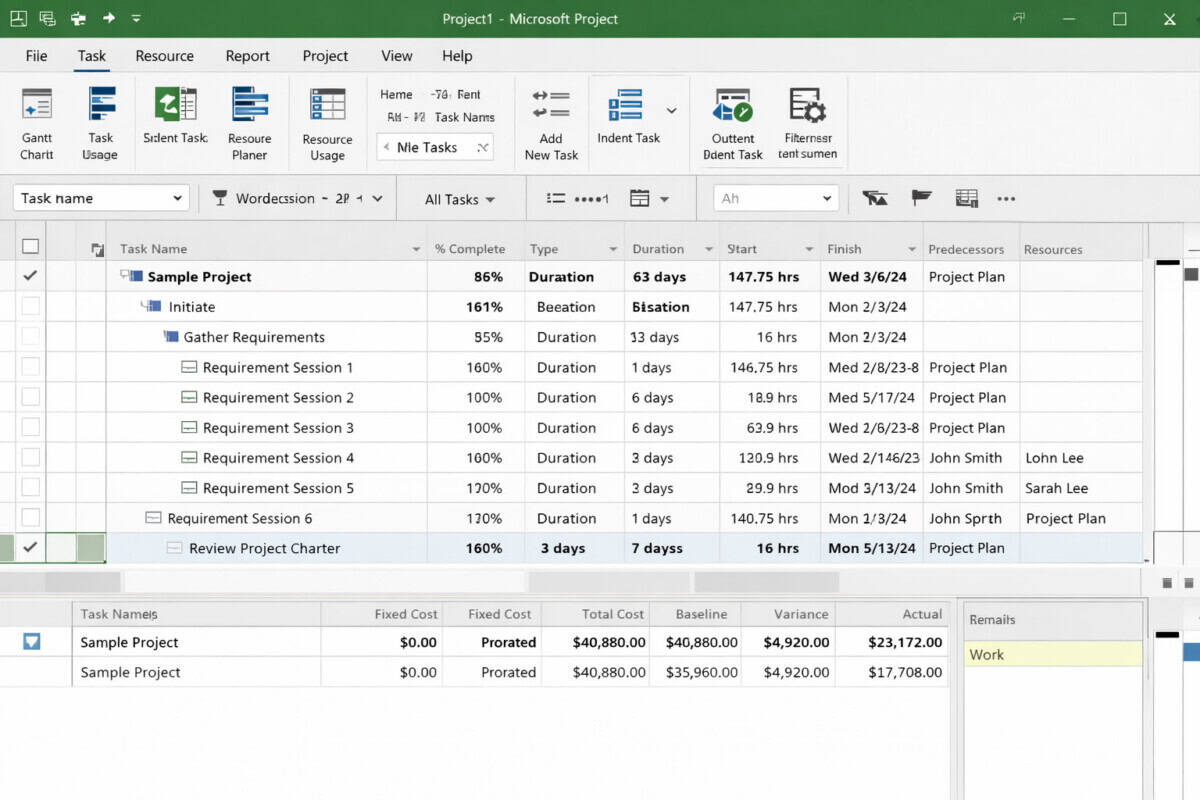
To review costs at the task level, use the combination Task Entry and Task Usage view with the Cost table applied. Follow these steps to access it:
- Open the Task Entry View: Click on the Task Entry View icon in the Resource Management toolbar, or click on the Gantt Chart view and select Split from the Window menu.
- Activate the Lower Pane: Click anywhere on the lower window pane to activate it, then select the Task Usage view in that lower pane.
- Apply the Cost Table: Select View, then Table, and choose the Cost table to display cost information for each task.
- Review Individual Task Costs: Click on any task in the upper window to view its detailed cost breakdown in the lower pane.
Understanding cost at the task level enables better meeting discipline as well. If a full team meeting costs hundreds of dollars per hour in aggregated resource time, that awareness motivates tighter agendas and more purposeful collaboration. Once all resources are assigned, verify that the total project cost does not exceed the approved budget. If it does, a scope change or funding supplement should be addressed before moving forward.
Step 3: Save the Project Baseline
Saving the project baseline is the single most important setup step for earned value measurement. The baseline captures the original plan, including planned start and finish dates, budgeted work, and budgeted costs, against which all future performance will be measured. Without a saved baseline, Microsoft Project has no reference point for calculating variances or earned value metrics.
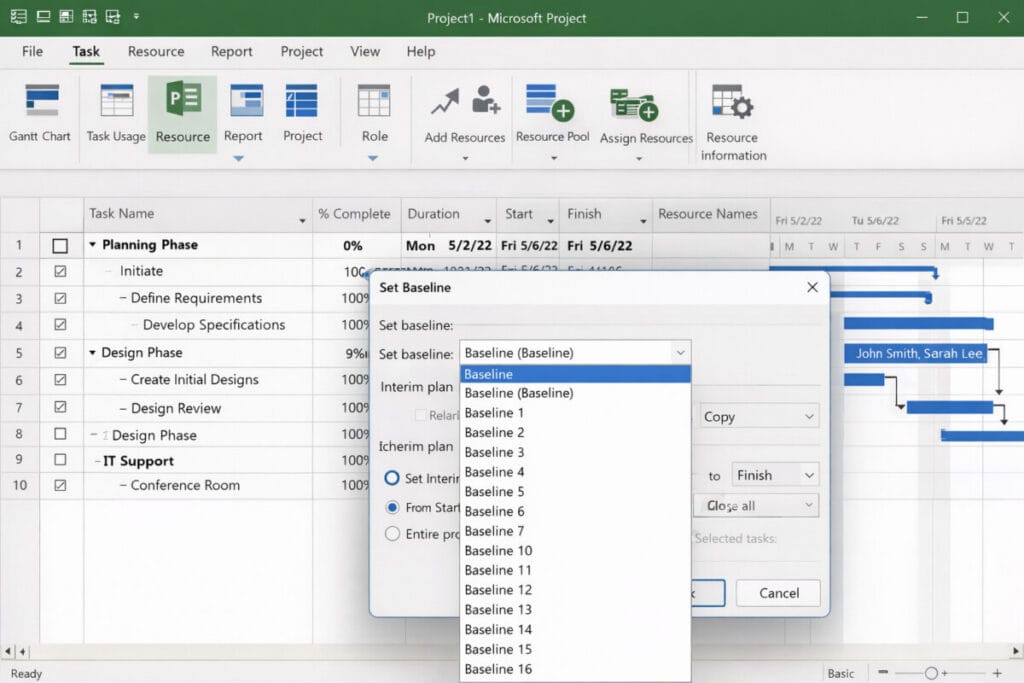
To save the project baseline, follow these steps:
- Open the Baseline Dialog: Select Tools, then Tracking, then Save Baseline. The Save Baseline dialog box will appear.
- Select the Baseline Option: Choose the Save Baseline radio button to confirm you are saving a new baseline rather than updating an interim plan.
- Choose the Scope: Select the Entire Project radio button to baseline the full plan, or select Selected Tasks to baseline only specific chosen tasks.
- Confirm and Save: Click OK to complete the baseline save. The Baseline Start, Baseline Finish, Baseline Work, Baseline Cost, and all earned value fields will be populated.
Microsoft Project also allows you to set the default earned value method for all new tasks in the Project Options dialog box, and you can choose which of the 11 available baselines to use for earned value calculations. For projects that are already underway without a saved baseline, it is still possible to baseline remaining future tasks and manually edit baseline data for completed or in-progress tasks, though this process is time-consuming and carries a risk of data inconsistency. Establishing the baseline before any work begins avoids all of these complications.
Step 4: Record Project Actuals
With the baseline in place and the team actively executing work, the next priority is to consistently record actual performance data. This means entering Actual Start and Actual Finish dates for completed tasks, as well as Actual Work hours for tasks that are in progress. Comparing these actuals to their corresponding baseline values is what enables Microsoft Project to calculate Schedule Variance (SV) and Cost Variance (CV).
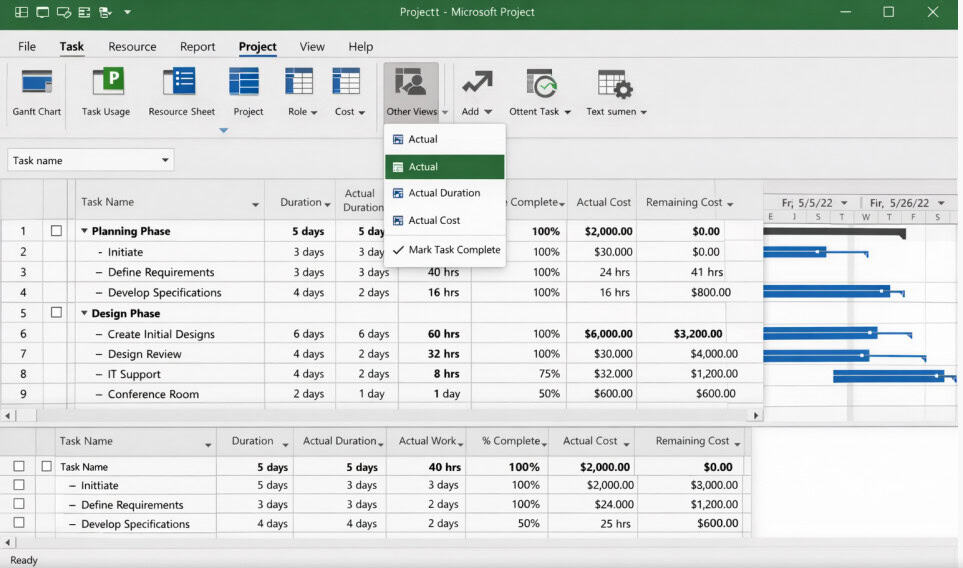
Consistency is the critical discipline here. Earned value is a point-in-time analysis, meaning the quality of the metrics depends entirely on how regularly and accurately actuals are updated. Project managers should establish a weekly update cadence where team members report their hours and progress, providing a reliable dataset for each status reporting cycle. If actuals are not entered for several weeks, the earned value calculations will reflect a status date far removed from current reality, making the resulting metrics unreliable.
Step 5: Review the Earned Value Views and Reports
Once actuals are recorded against the baseline, earned value data is available through dedicated views and reports within Microsoft Project. Project displays earned value information in two ways: with views and with reports. Follow these steps to access the Earned Value table:
- Select the Correct Pane: If you are using a combination view, select the window pane where you want the earned value information to appear.
- Open the More Tables Menu: Select View, then Table, then the More Tables menu item. The More Tables dialog box will appear with a list of available table options.
- Select the Earned Value Table: Choose from the Earned Value, Earned Value Cost Indicators, or Earned Value Schedule Indicators tables depending on your reporting need, then click OK.
- Review Task-Level Data: The current earned value information will be displayed for each task in the project plan.
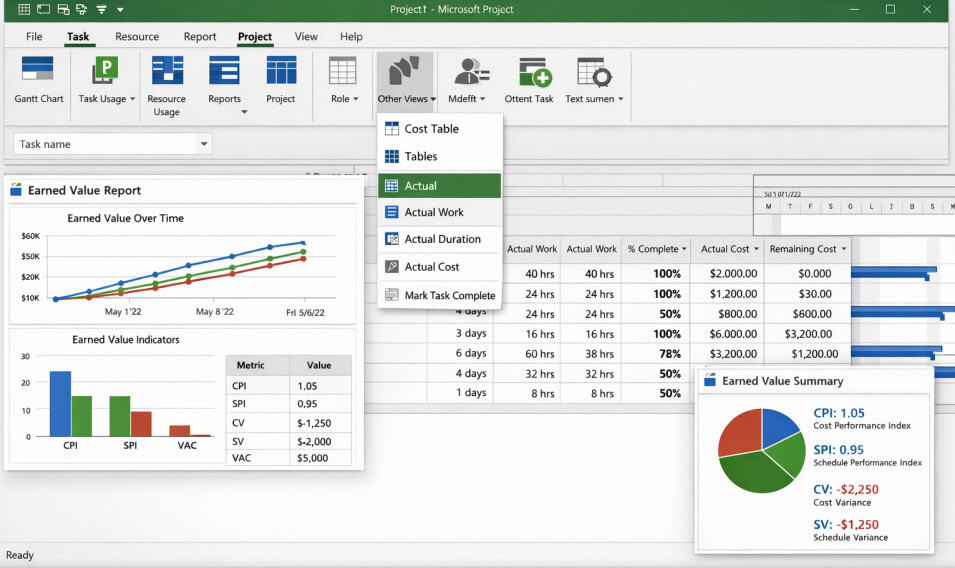
The Earned Value table presents eight core fields for every task. These are described below.
- BCWS (Budgeted Cost of Work Scheduled): This is the planned value, representing the budget allocated for work that was scheduled to be completed by the status date.
- BCWP (Budgeted Cost of Work Performed): This is the earned value itself, reflecting the budgeted amount for work actually completed as of the status date.
- ACWP (Actual Cost of Work Performed): This is the actual cost incurred for the completed work, regardless of what was originally budgeted.
- SV (Schedule Variance): This is the difference between BCWP and BCWS, indicating whether work is ahead of or behind the planned schedule in cost terms.
- CV (Cost Variance): This is the difference between BCWP and ACWP, indicating whether the project is delivering value for less or more than was budgeted.
- EAC (Estimate at Completion): This is a forward-looking projection of the total project cost if current performance trends continue through to completion.
- BAC (Budget at Completion): This is the total approved baseline budget for the entire project.
- VAC (Variance at Completion): This is the projected difference between BAC and EAC, indicating the expected cost overrun or saving at project close.
To run the Earned Value report separately, follow these steps:
- Open the Reports Menu: Select View, then Reports.
- Navigate to Cost Reports: Click on the Costs icon and click Select.
- Run the Earned Value Report: Click on the Earned Value report and click Select to generate the full task-level report.
When communicating earned value metrics to stakeholders, it is worth confirming that recipients can interpret the indices correctly, as sharing visual charts alongside the figures is often more effective than presenting raw numbers alone.
Step 6: Calculate Schedule Performance and Cost Performance Indices
The Schedule Performance Index (SPI) and Cost Performance Index (CPI) normalize earned value data into ratios, making them easy to interpret and compare regardless of project size or budget scale. Both are calculated using straightforward formulas:
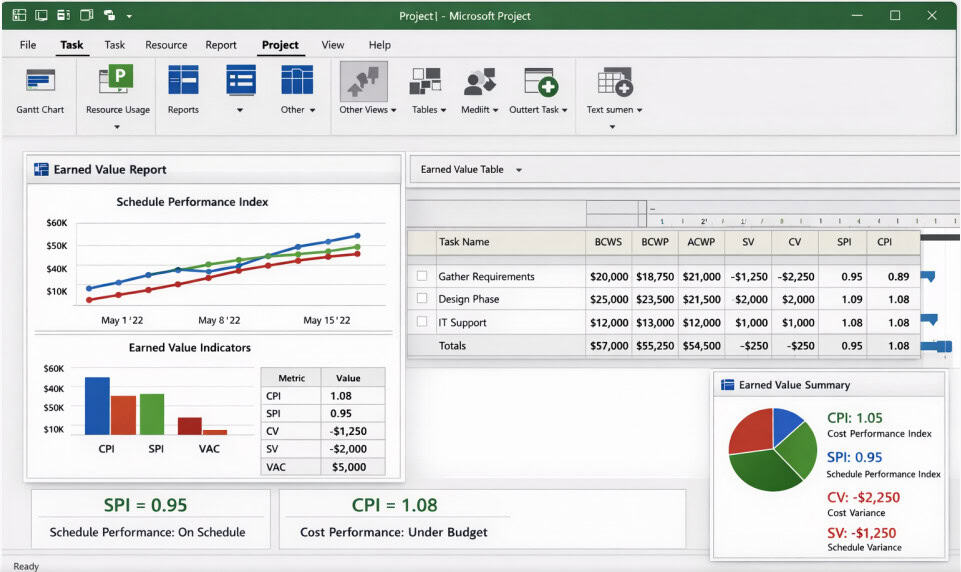
- SPI = EV / PV
- CPI = EV / AC
An index value of 1.0 means the project is performing exactly as planned. Values below 1.0 indicate underperformance, while values above 1.0 indicate more efficient delivery than planned. In a project where BCWP is $19,575, BCWS is $23,570, and ACWP is $23,170, the SPI is 0.83, and the CPI is 0.84. Both figures below 1.0 confirm the project is behind schedule and over budget, signaling that corrective action is needed.
These indices should be included in every project status report. They provide stakeholders with an objective, concise summary of project health that complements the narrative commentary project managers typically provide. A project can often run behind schedule or over budget for a given reporting period without it being cause for alarm, but consistently declining SPI and CPI values across multiple periods are a reliable signal that the project requires intervention.
Choosing the Right Tool: Microsoft Project vs. Microsoft Planner
As the Microsoft ecosystem evolves, project managers should understand which tool is appropriate for earned value work. Microsoft Project provides robust tools for complex project management, including advanced resource management, financial management tools, and Gantt charts, making it suited to large-scale planning and performance tracking. Full earned value functionality, including all six steps described in this article, is supported in the Project desktop client through Project Standard 2024 and Project Professional 2024.
The new Microsoft Planner offers a single, unified way to manage work, combining the simplicity of Microsoft To Do, the collaborative features of Planner, the advanced capabilities of Microsoft Project, and the intelligence of Microsoft 365 Copilot into one solution. Planner Premium includes baseline functionality and advanced dependencies with lead and lag, as well as AI-powered project management tools through the Project Manager agent. Teams evaluating whether to remain on the desktop client or transition to Planner Premium should assess whether their earned value reporting requirements can be met within the unified platform, particularly for enterprise projects with strict EVM compliance requirements.
Additional Earned Value Management Resources
- Earned Value Project Management by Quentin Fleming
- Earned Value Management 3rd Edition by Quentin Fleming
- Practice Standard for Earned Value Management by Project Management Institute
Conclusion
Earned value management transforms a project plan from a list of tasks into a performance measurement system. By following the six steps outlined here, including entering resources with accurate cost rates, assigning them to tasks, saving a baseline, recording actuals consistently, and reviewing the earned value views and indices, project managers gain a reliable, data-driven picture of project health. The discipline required to maintain this process is what separates reactive project management from genuinely proactive delivery.
As the Microsoft project management landscape continues to consolidate around Planner Premium and the desktop client, the underlying principles of earned value remain unchanged. The tools evolve, but the need to measure planned value against actual performance, track variances, and forecast completion costs is as relevant as ever. Project managers who invest in setting up earned value correctly will have the metrics they need to hold meaningful conversations with stakeholders and take timely corrective action.
Frequently Asked Questions
What is the difference between SPI and CPI in earned value management?
SPI, or Schedule Performance Index, measures how efficiently the project is progressing against the planned schedule, calculated as earned value divided by planned value. CPI, or Cost Performance Index, measures how efficiently the project is using its budget, calculated as earned value divided by actual cost. Both indices use 1.0 as the baseline for on-track performance, with values below 1.0 signaling underperformance in their respective dimensions.
What happens if I forget to save a baseline before work begins?
If the project baseline is not saved before execution starts, Microsoft Project has no reference point for calculating earned value metrics. You can still baseline remaining future tasks and manually edit baseline data for completed or in-progress tasks, but this process is time-consuming and introduces the risk of data inconsistencies. Saving the baseline before any work begins is always the recommended approach.
Can earned value analysis be used on projects without external billing?
Yes. Even if no resources are billed to a client, earned value remains a valid internal performance measurement tool. Internal IT or operational projects can assign standard cost rates to resources to reflect the true organizational cost of the work, allowing project managers to track cost efficiency and schedule performance even when no money changes hands with an external party.
How does Microsoft Project determine the earned value status date?
Earned value analysis in Microsoft Project assumes you want to see project progress as of a specific point in time that you choose, known as the status date. If no status date is set in the Project Information dialog box, Microsoft Project defaults to the current system date. This means that if actuals have not been updated for several weeks, the earned value calculations will reflect a growing gap between the last recorded progress and today, overstating variances and distorting the picture.
Is earned value management supported in Microsoft Planner Premium?
Planner Premium includes baseline functionality and advanced dependencies with lead and lag, which are foundational components of an earned value workflow. However, the full suite of dedicated earned value tables and reports available in the Microsoft Project desktop client, such as the BCWS, BCWP, and ACWP fields and the Earned Value Cost and Schedule Indicators tables, is not replicated in Planner at the same depth. Organizations with formal EVM compliance requirements, particularly those working on government contracts, should evaluate whether the desktop client better meets their reporting obligations.
Suggested articles:
- The Pros and Cons of Using MS Project Software
- Microsoft Project Pricing Plans & Costs Guide
- Microsoft Project Tutorial: Import Excel Into Microsoft Project (Planner)
Andrew Makar, DMIT, PMP, CSM is an IT director with delivery experience across projects, programs and portfolios in Digital Marketing, Automotive, Software and Financial Management industries. He is an enthusiastic leader who effectively translates project management theory into practical application. His area of interest and practice is in implementing Agile processes and SCRUM techniques to deliver better software to his customers. Find out more about Andrew on andymakar.com and please reach out and connect with Andrew on LinkedIn.