

The Kano Model Analysis identifies and contrasts customer requirements with incremental product needs in a structured way that teams can apply. Created by Noriaki Kano toward the end of the 1980s, this methodology applies critical thinking directly to product feature prioritization. Understanding what customers truly value versus what they simply expect is the foundation of smarter product development and business decisions.
This survey methodology evaluates a variety of functions within a product and measures them by levels of customer satisfaction, from total satisfaction to total dissatisfaction with the results. The Kano model operates on three core principles that are essential to understand: satisfaction depends on feature functionality, features are classified into four categories, and questionnaires determine how customers feel about each specific feature being evaluated and considered for development work.
Attributes of the Kano Model Analysis
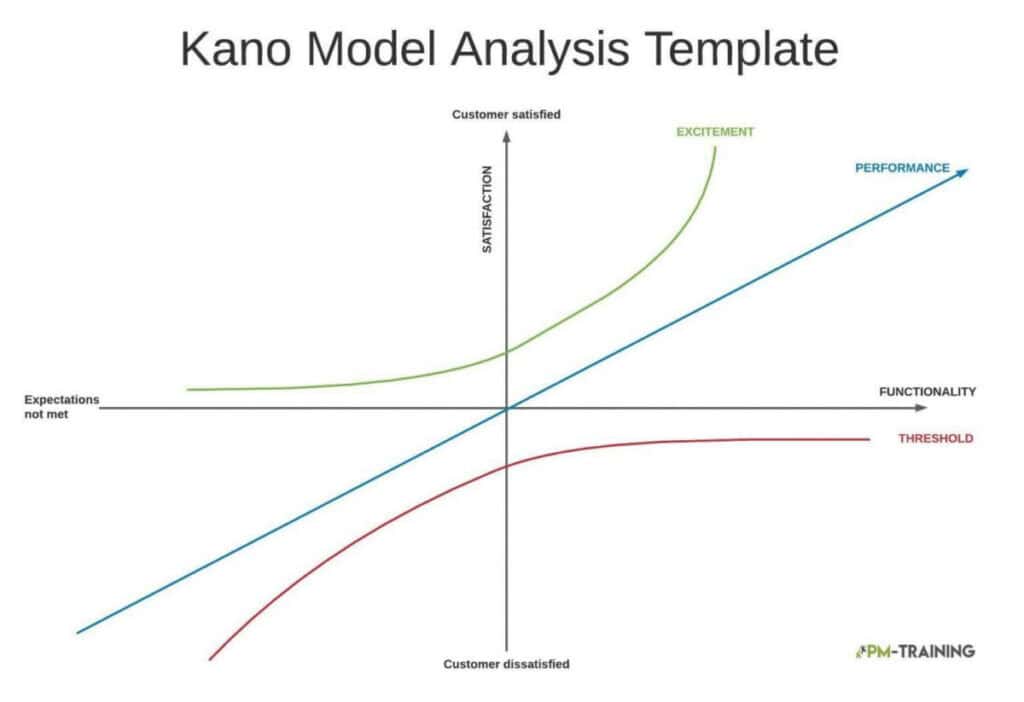
Product features can be classified into four categories as they relate to functionality and customer satisfaction levels. Each category represents a different relationship between feature presence and customer response that teams must understand. Grasping these categories is essential for effective product prioritization and smart resource allocation across development cycles and product roadmaps.
When basic needs are satisfied in a product, it positions itself in the market. The satisfaction of performance needs allows it to maintain that position, whereas fulfilling attractive needs allows the product to gain traction as a top leader in its category.
Performance
Performance features are classified as attributes that consumers expect to have in a product and directly correlate to their satisfaction levels. Customers like their presence and actively dislike not having them available. This correlates to a “more is better” response where the more that is provided, the higher customer satisfaction becomes over time and use.
- Increased battery life for a phone
- The amount of storage a cell phone has
- Faster data speeds for mobile devices
Must Be
Must-be features are specific requirements that must exist in the product or the customer will not use it at all. These can also be called assumed features since customers take them for granted. Since the feature is expected, it does not contribute to satisfaction when present, but its absence greatly contributes to dissatisfaction and outright product rejection.
- A cell phone that makes phone calls
- A cell phone that has a charging port
- A cell phone that is able to use mobile data
Attractive
Attractive features are not expected by customers at all, yet they find themselves liking them when discovered in a product. These are delighting features that exceed customer expectations and contribute to increasing the product’s perceived value and overall appeal. They are also the features that truly separate a product from its competition in a crowded marketplace.
- 5G data capability for a cell phone
- A cell phone company offering monthly rewards to customers
- A cell phone carrier including hotspot data in standard packages
Indifferent
Indifferent features create a neutral reaction from customers where there is no emotional investment, whether the feature is added or removed from the product entirely. It is vital not to invest heavily in features users are indifferent to, as they neither influence nor detract from the product’s overall perceived value or marketability in any meaningful way.
- The color of the charging cable
- The color of the cell phone camera lens
- The serial number for a cell phone
There is also room to identify undesirable attributes that actively create dissatisfaction. These “better not be” features make a product less attractive regardless of necessity. Undesirable features contribute to reasons why a customer would choose not to buy a product, so identifying them early is critical.
Why Product Features Can Change
There is a dynamic nature to how customers respond to features over time. An attractive feature can become a performance feature, and that performance feature can eventually become a must-be feature. Meeting a must-be requirement fulfills the bare minimum of product development and will neither exceed expectations nor increase satisfaction on its own.
The most common example is the evolution of cell phones. Shifting from flip phones to touch screens was once considered an exciting and attractive innovation. Now it is a feature that customers 100% expect when shopping for a new phone. Creating a cell phone without a touch screen would be a detrimental business move. Customers generally appreciate the right changes, but eventually those changes become baseline requirements.
Kano Model Benefits and Advantages
The Kano Model Analysis is a powerful way to uncover what customers truly value versus what they simply expect. By translating satisfaction and dissatisfaction into actionable categories, it helps teams prioritize product work with confidence, reduce waste, and focus investment where it most strongly influences adoption and long-term market success.
Here are the key benefits you can expect when using the Kano Model:
- Stronger Customer Value Clarity: Identify which features are table stakes (must-be), which drive satisfaction (performance), and which create delight (attractive), so decisions are grounded in real user impact.
- More Effective Prioritization: Compare feature categories to determine what should be built first—so roadmaps reflect customer outcomes, not internal preferences.
- Reduced Resource Waste: Limit spending on features that don’t move the needle (e.g., indifferent items) and avoid heavy investment in low-impact work.
- Better Trade-Off Decisions: Make explicit choices about baseline requirements versus differentiators, helping teams balance cost, effort, and customer payoff.
- Higher Adoption Focus: Evaluate product aspects based on how they influence adoption at scale, which is especially useful for both consumer and non-consumer solutions.
- Improved Cross-Functional Alignment: Provide a shared, customer-based framework for Product, Design, and Engineering, reducing debate and increasing agreement on priorities.
- Tangible, Research-Driven Feature Selection: Encourage selecting a small set of meaningful, testable features—improving the quality of insights and the speed of follow-up actions.
- More Accurate Insights Through Demographics: Use segmentation and gather at least 15+ customers per demographic to produce results that are more reliable and representative.
- Clear Direction for Iteration Over Time: Recognize that feature categories can evolve (attractive → performance → must-be), helping teams plan for shifting expectations.
- More Structured Survey Execution: Guide teams to ask about both presence and absence of features, leading to clearer scoring and less ambiguous conclusions.
- Efficient Analysis Scope: Keep the number of features prioritized at once to a maximum of three, enabling deeper understanding without overwhelming participants or muddying results.
How to Facilitate a Kano Model Analysis Session
When distributing a Kano Model survey, start with a brief explanation of the survey’s purpose and clear instructions for participants. This context helps respondents understand what you’re asking of them and why. Include a way to identify respondents so you can trace specific answers back to specific customers. Google Forms is a simple option here; it can capture respondent identity automatically without requiring customers to enter it manually.
Each question should be clear, concise, and focused on a single feature. Frame questions so customers can see the benefit of the feature, and pair this with a separate question on how important that feature is to them. Surveys can use either interaction-based (visual/prototype) or text-based question formats.
For each feature, ask three questions:
- If you had (feature), how would you feel?
- If you didn’t have it, how would you feel?
- How important is it that this feature is available in the product?
The first two are known as the functional and dysfunctional questions — they capture how customers react to a feature’s presence and absence. Present them as multiple choice so each response can be scored consistently. The standard five-point scale is:
- I like it
- I expect it
- I’m neutral
- I can tolerate it
- I dislike it
This scale captures the full range of satisfaction and dissatisfaction a feature can produce. Cross-referencing the functional and dysfunctional responses is what allows you to classify each feature correctly. For example, a feature that gets a neutral reaction when present but a negative reaction when absent would typically be classified as a must-be (basic) feature.
Wherever possible, show features rather than just describing them; prototypes or mockups work well. Seeing a feature in context improves customer understanding and reduces ambiguity in their responses.
Kano Survey Model
To avoid false positives, send a Kano survey to your customers to find out what they really think about your product. This works best when customers are already familiar with the product and do not need additional context or explanation. Kano surveys use a special questionnaire style designed to capture the right feedback from users.
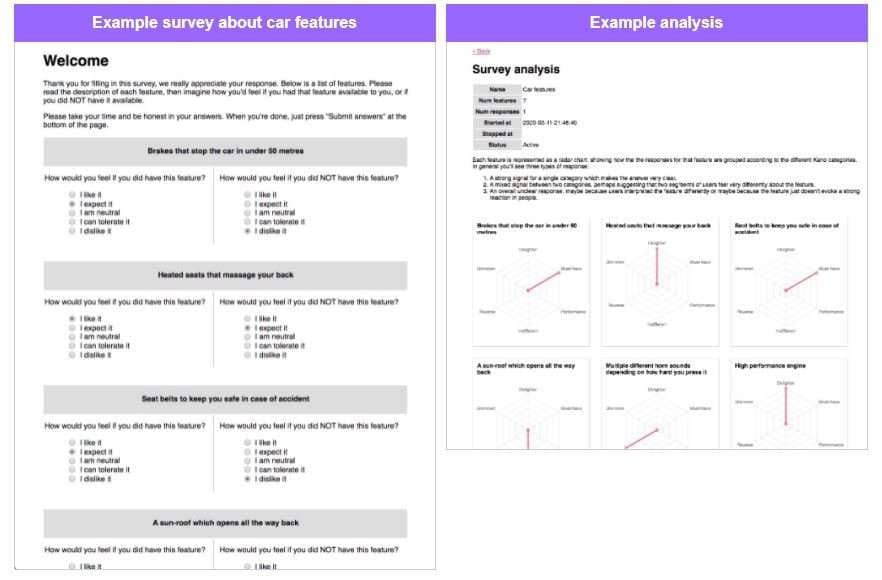
Kano surveys are a special style of questionnaire designed to capture the right feedback from users, and bespoke analysis of that data is needed to categorize features according to the Kano model. Visit kanosurveys.com for more information on conducting effective surveys.
Our Kano Model Analysis Google Template
You can create a copy of our Kano Model Analysis Google Slides template by navigating here and clicking Create Copy. This template gives you a ready-to-use framework for organizing your feature analysis and collaborating with your team in real time. Simply duplicate the slide, share it with your team, and begin inputting your data immediately.
Alternate Kano Model Templates
There are many platforms available for developing and building your Kano Model Analysis with your product development team members. Finding the right platform for your team is important for smooth collaboration and accurate data collection across multiple projects and initiatives. Each platform offers different strengths depending on your team’s workflow, budget, and technical comfort level.
Miro
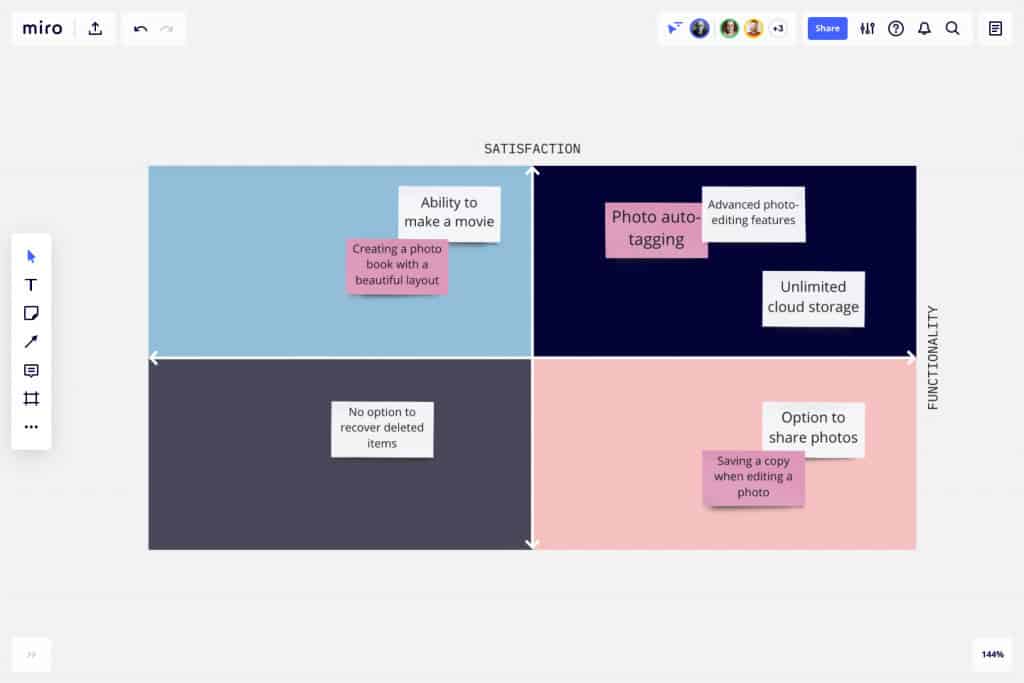
Miro is an online platform that allows teams to collaborate through multiple formats and tools. Miro provides a Kano Model Template that allows your organization to collaborate on inputting information gathered through a Kano Model Analysis session in a visual, interactive workspace.
LucidChart
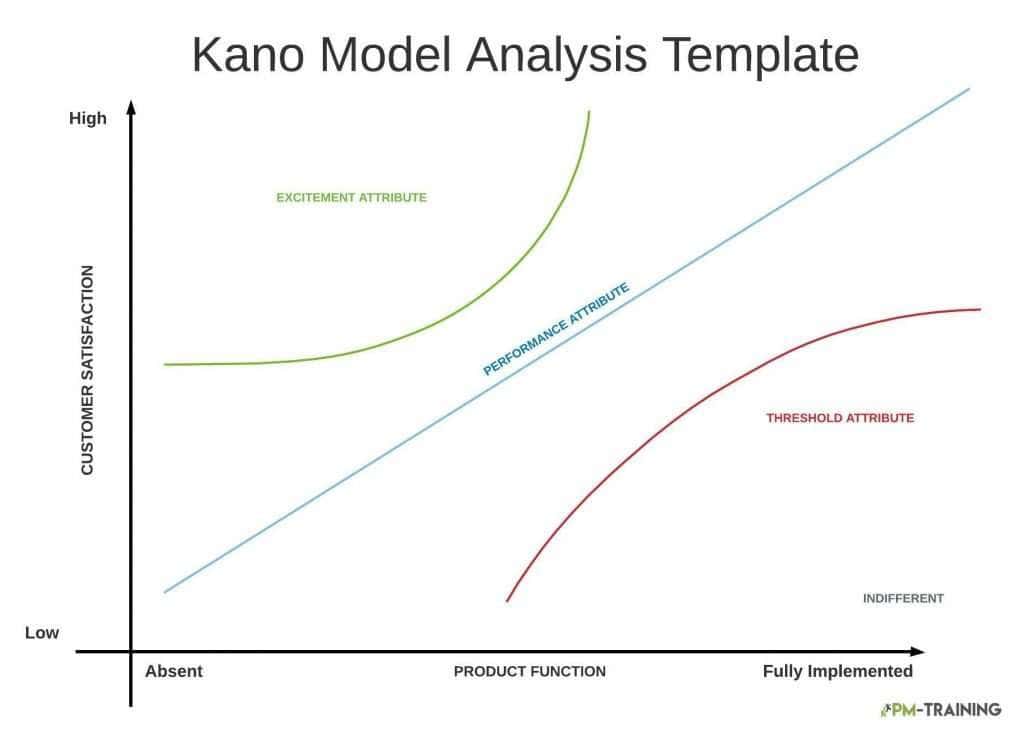
LucidChart provides a useful tool for working with text-heavy documentation and spreadsheets. Its ability to convert data visually brings ease to team collaboration. LucidChart has a built-in Kano Model template that makes it easy for your team to input and analyze feature data together.
Google Docs
Google Docs is a best free option for your team to collaborate in developing a Kano Model analysis. While it does not have a built-in template, you can create one and share it among your team members. Google Docs also works well for building customer surveys that help you track identifiers and responses.
SurveyMonkey
SurveyMonkey is an exceptional platform for building your Kano survey. Your customers will have the option to easily work through all questions and input additional information that you may find useful for your analysis and product decisions.
Alternatives to Kano Model Analysis Technique
Several popular alternatives to the Kano Model Analysis exist, each measuring different criteria for prioritization efforts and decisions. When selecting which technique to use, consider simplicity, data-driven prioritization, technology constraints, and business value. Each method has a best use case depending on your specific situation and what you need to learn from your analysis work.
MoSCoW
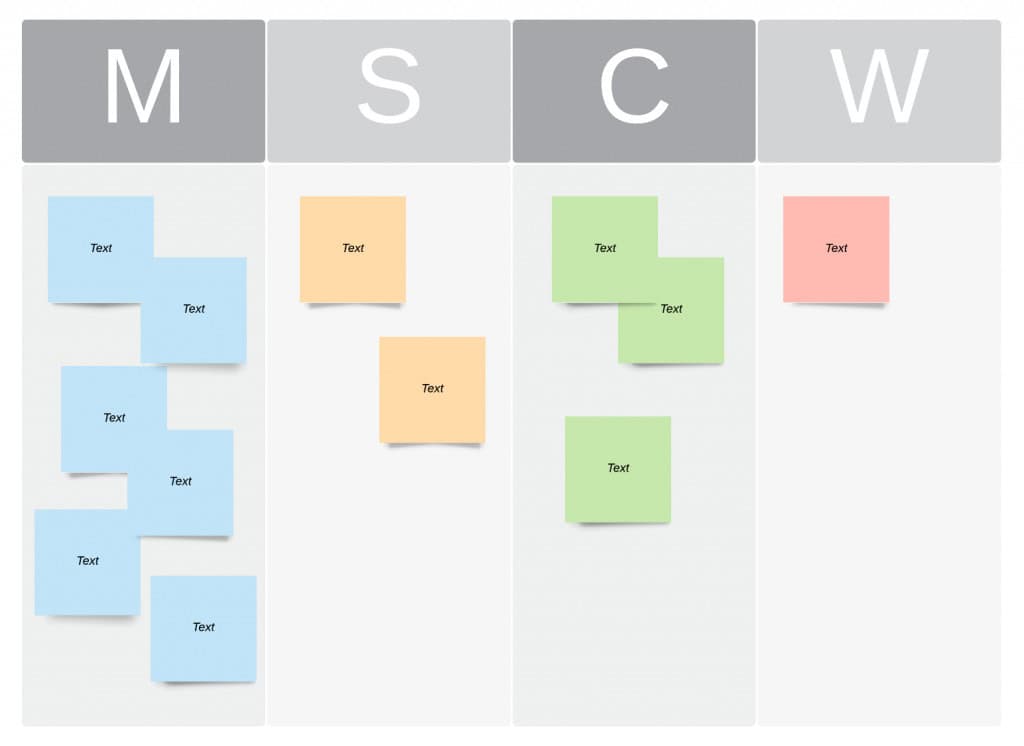
MoSCoW stands for Must, Should, Could, and Won’t. It is one of the simplest methods for evaluating how important each task or feature is. The four groups that make up the acronym guide teams in prioritizing requirements effectively. Learn more about MoSCoW Prioritization in Agile for practical implementation guidance.
RICE
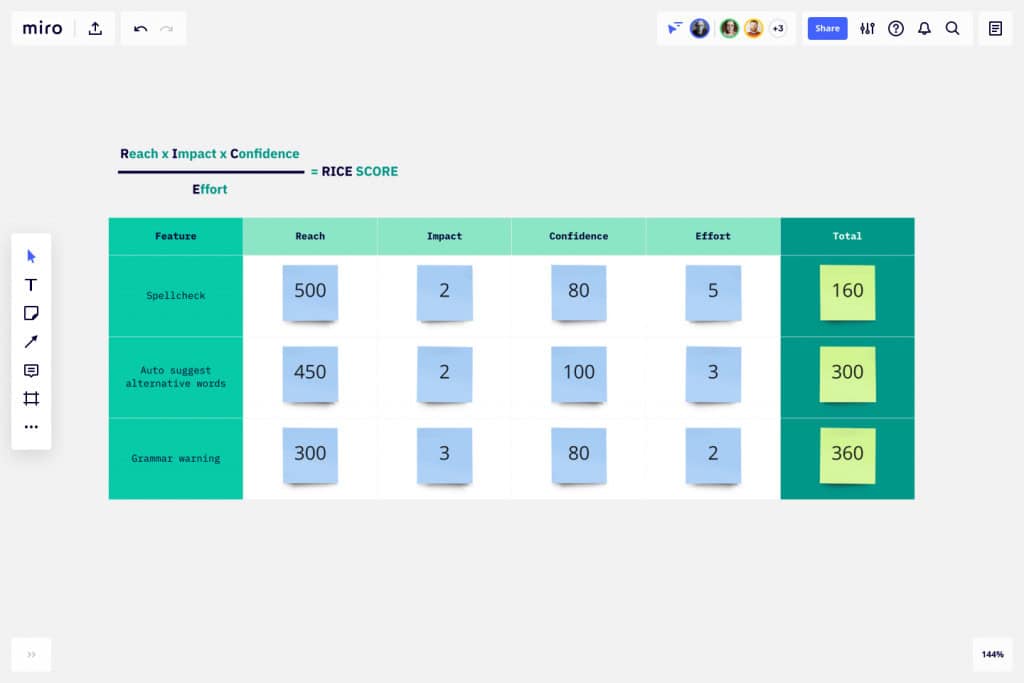
RICE stands for Reach, Impact, Confidence, and Effort. It is a comprehensive methodology for evaluating customer priorities that incorporates multiple dimensions of estimation. The RICE Score Model in Miro provides a visual framework for applying this technique to your product decisions.
Eisenhower Matrix
The Eisenhower Matrix is a four-quadrant technique used to prioritize backlogged tasks. Each quadrant represents where each task should be allocated: high priority, medium priority, urgent but not important, and low priority. This method helps teams quickly sort through competing demands.
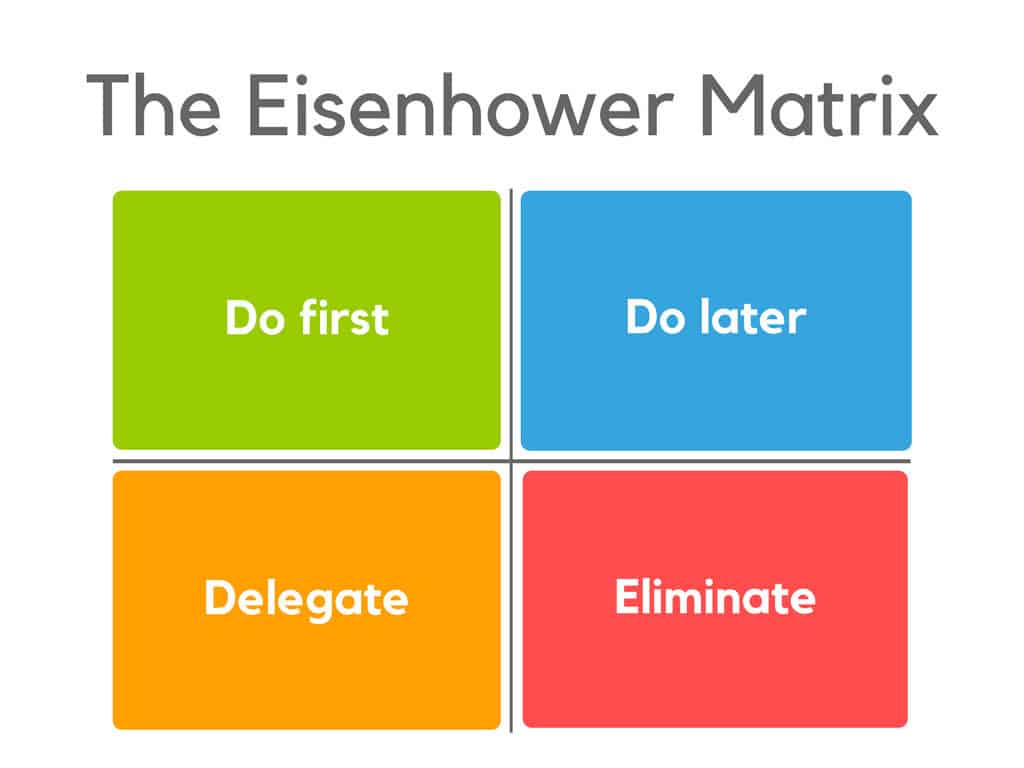
Illustration from Medium: Eisenhower Matrix (Increase Your Productivity)
Value vs Complexity
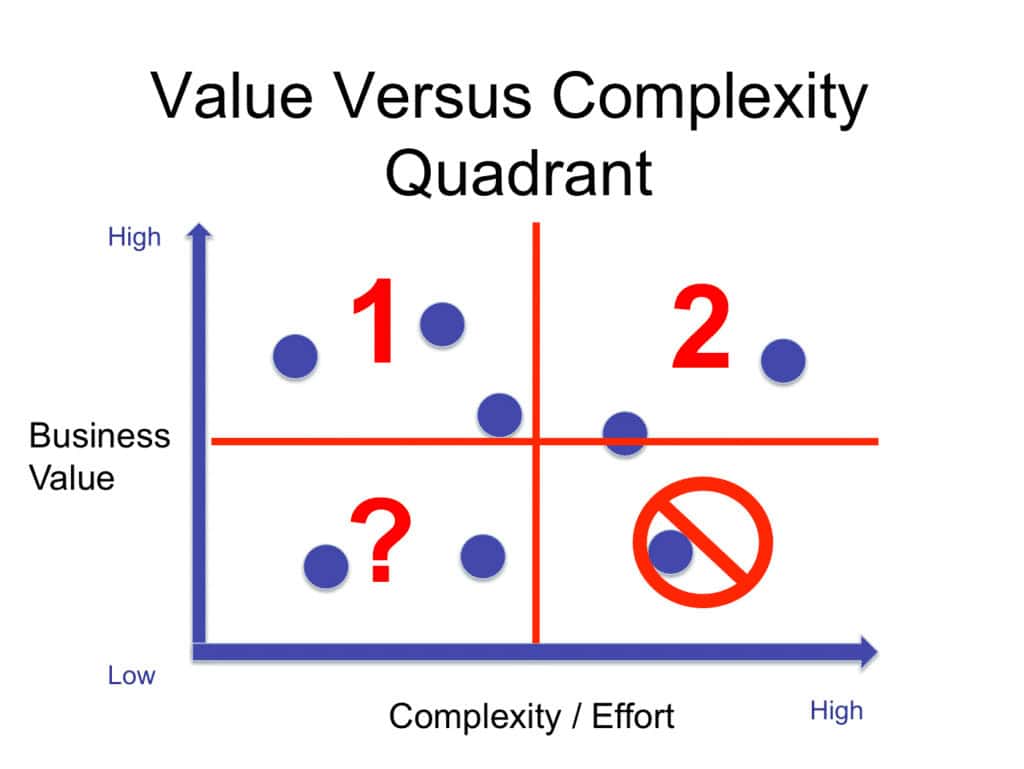
The Value vs Complexity Matrix is similar to the Eisenhower Matrix in that tasks are allocated across four quadrants using two dimensions. The prioritized tasks are those that are high in value but low in complexity. This approach balances business impact with development effort for smarter resource allocation.
WSJF
WSJF, which stands for Weighted Shortest Job First, is a method for introducing the minimum level of marketable features of a product. This measurement specifically orders features to place high added value into less comprehensive items at the top priority and complicated features with lesser value toward the bottom of the backlog.
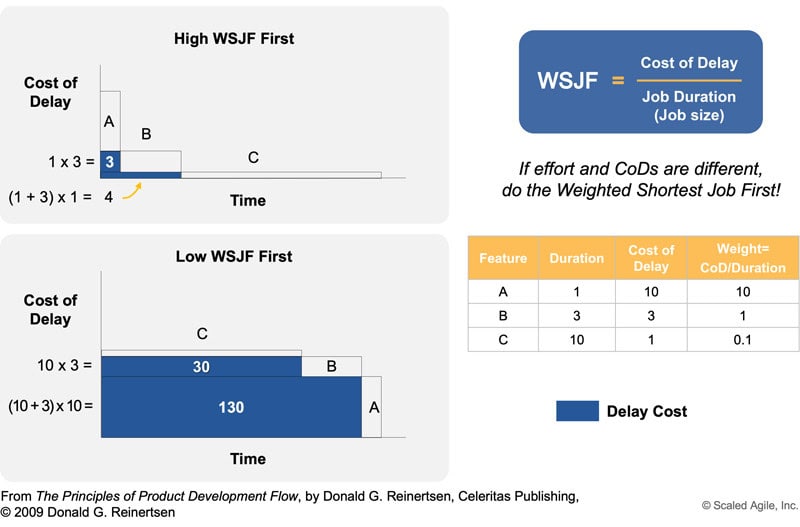
WSJF Figure | Scaled Agile Framework
Walking Skeleton
The Walking Skeleton defines which features are vital for the functionality of a product from the start. While it does not put requirements into categories, it focuses on user reports that prioritize key features, system functionality, business value, and testing of the entire production pipeline.
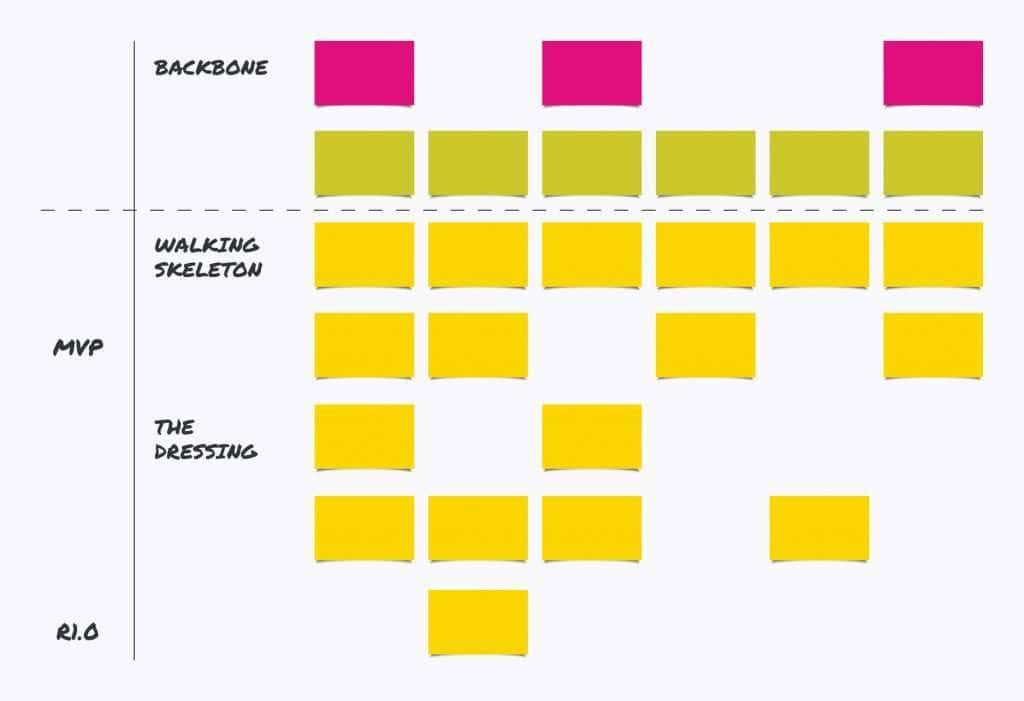
Walking Skeleton Story Map | Equal Experts
Video Explaining How the Kano Model Works and How to Use It
Want to make the Kano Model feel simple (and actually usable) for your team? In this quick video, you’ll see how Kano works, what questions to ask, and how to translate customer feedback into clear feature prioritization, so you can confidently shape your roadmap with less guesswork.
Conclusion
The Kano Model Analysis provides product teams with a structured, customer-centered approach to feature prioritization that reduces guesswork and wasted development effort significantly. By classifying features into performance, must-be, attractive, and indifferent categories, teams gain clarity on where to invest resources for maximum positive impact on customer satisfaction and overall competitive positioning within their market space and industry landscape.
Using the free Google template and following the facilitation guidelines from this article, any team can conduct their own Kano analysis and make data-driven decisions about their product roadmap with full confidence. Alternatives like MoSCoW, RICE, and the Eisenhower Matrix offer complementary approaches for different scenarios, but the Kano Model remains the gold standard for understanding the emotional impact of features on customer satisfaction and long-term product success over time.
Frequently Asked Questions
What is the Kano Model Analysis?
The Kano Model Analysis is a framework developed by Noriaki Kano that classifies product features into four categories based on how they affect customer satisfaction. It helps teams prioritize features by understanding which ones delight customers, which ones they expect, and which ones they are indifferent to.
How do I use the Kano Model Google template?
Click the link to the Google Slides template and select Create a copy. This gives you an editable version that you can share with your team. Populate each slide with your feature data, customer responses, and category classifications as you complete your analysis session.
What are the four categories of the Kano Model?
The four categories are Performance, Must Be, Attractive, and Indifferent. Performance features increase satisfaction the more you provide them. Must Be features are expected and cause dissatisfaction if missing. Attractive features delight customers unexpectedly. Indifferent features do not affect satisfaction either way.
How many features should I analyze at once?
It is recommended to analyze no more than three features at a time for the most accurate results. Selecting too many features dilutes the quality of feedback and makes it harder to prioritize effectively based on clear customer responses.
What is the difference between Kano Model and MoSCoW?
The Kano Model focuses on customer satisfaction and feature categorization based on emotional response, while MoSCoW prioritizes based on business and technical necessity. Kano is best for understanding customer value, and MoSCoW is best for making build decisions within constraints like time and budget.
Suggested articles:
- 18 X Product Canvas Template PPT, Word
- 18 x Product Launch Plan Templates
- 7 Free Release Notes Templates

Shane Drumm, holding certifications in PMP®, PMI-ACP®, CSM, and LPM, is the author behind numerous articles featured here. Hailing from County Cork, Ireland, his expertise lies in implementing Agile methodologies with geographically dispersed teams for software development projects. In his leisure, he dedicates time to web development and Ironman triathlon training. Find out more about Shane on shanedrumm.com and please reach out and connect with Shane on LinkedIn.