
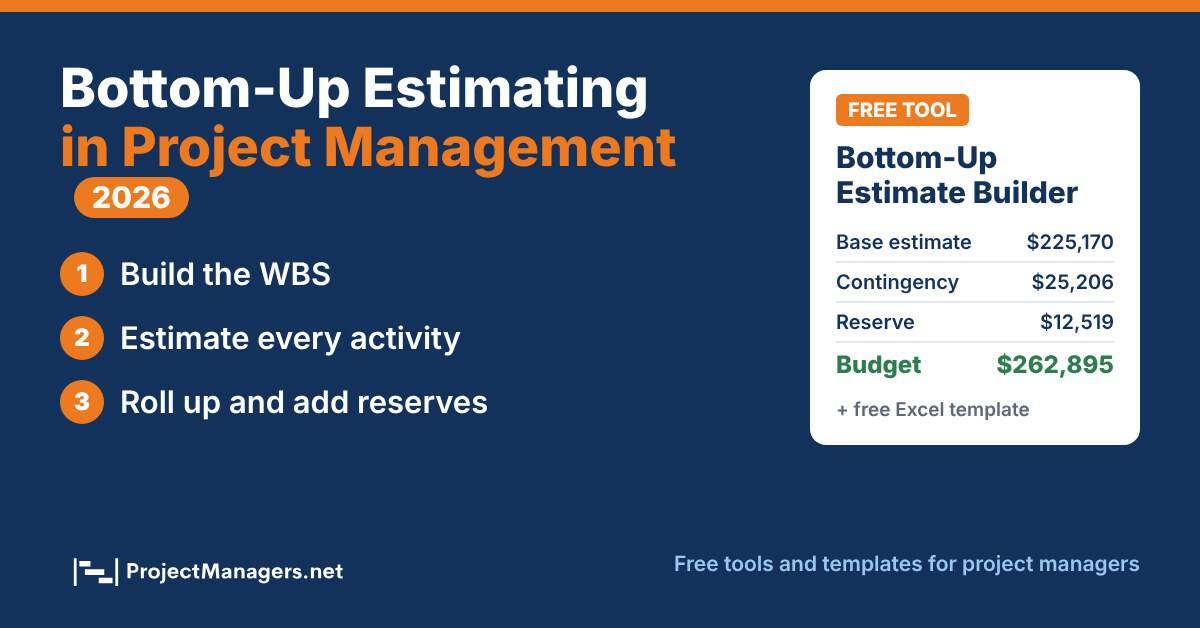
Bottom-up estimating is the project estimating technique where the project team estimates every activity in the work breakdown structure (WBS), then adds those estimates together to get the cost, effort and duration of the whole project. Project managers use it when they need a budget and schedule they can defend line by line, because every number traces back to a specific piece of work and the person who estimated it.
- Bottom-up estimating breaks the project into activities, estimates each one, and rolls the numbers up to work packages, deliverables and the total project.
- It is the most detailed estimating technique, but it is only as good as the WBS: work you forget to list is work you forget to fund.
- The people who will do the work should estimate it, and the project manager should add contingency by confidence plus a management reserve on top.
- Use it once scope is defined; use top-down, parametric or three-point estimates earlier or as a cross-check.
Think about writing a book. Asking “how long will the book take?” gives you a guess. Asking how long each chapter will take to research, draft and edit gives you an estimate, because you are now judging small pieces of work you can picture. Bottom-up estimating applies the same logic to any project, from a house build to a software release: break the work down until each piece is small enough to estimate with confidence, estimate the pieces, then add them up.
This guide shows project managers how bottom-up estimating works, the six steps to build one, a worked home construction example, how it compares with top-down, parametric and three-point estimating, and when it is not worth the effort. You can also build your own estimate with the free tool and Excel template below.
What Is Bottom-Up Estimating?
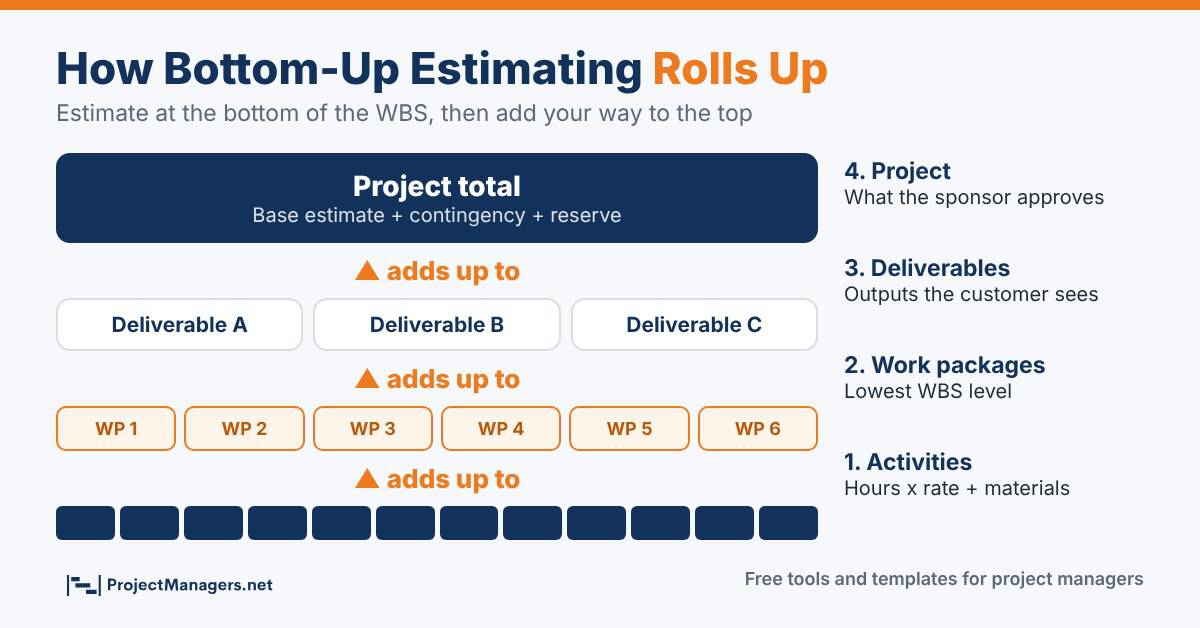
The PMI PMBOK Guide defines bottom-up estimating as a method of estimating project duration or cost by aggregating the estimates of the lower-level components of the WBS. In plain terms, you estimate at the bottom of the work breakdown structure and add your way to the top.
The roll-up has four levels in most projects:
- Activities: the individual tasks, such as “install the electrical panel”. This is where the hours, rates and material costs are estimated.
- Work packages: the lowest level of the WBS, made up of related activities. The project team manages and tracks work at this level.
- Deliverables: the outputs the customer or sponsor cares about, such as “electrical system complete”.
- Project total: the sum of all deliverables, plus the contingency and management reserves the project manager adds.
The same roll-up works for cost (hours multiplied by rates, plus materials, equipment and fees), for effort (total hours) and for resource needs (how many electricians, developers or testers the project requires, and when). Duration is different: you cannot simply add activity durations, because some activities run in parallel. For the schedule, project managers feed the activity durations into a network diagram to find float and the critical path.
Government cost estimators call the same technique an “engineering build-up” estimate. Whatever the name, the rule is the same: the total is only trustworthy if the list of work underneath it is complete.
Real-life example
US government programs use the engineering build-up method
The US Government Accountability Office (GAO) lists the engineering build-up method, built from labor hours by WBS element, quantities and rates, as one of the main cost estimating methods for federal programs. It notes that the method shows exactly what an estimate includes and is easy to audit, but is slow and costly to produce, and that small errors can grow as estimates are summed or items are left out.
Numbers that matter
- -3% to -10%low end of the expected accuracy of an AACE Class 1 estimate, the class built from detailed take-offs once 65% to 100% of the project is definedSource: AACE 18R-97 summary (EPCLand)
- +3% to +15%high end of the same Class 1 range, compared with -50% to +100% for a Class 5 concept estimateSource: AACE 18R-97 summary (EPCLand)
Why Bottom-Up Estimating Matters for Project Managers
Every project works inside constraints set in the project charter: a budget, a deadline and a limited team. Bottom-up estimation lets project managers test whether the project can really be delivered inside those constraints before anyone signs a commitment. Without that test, teams promise dates and budgets that were never achievable, and the project spends its life explaining overruns.
Bottom-up estimating also helps project managers in four practical ways:
- It exposes missing scope. Listing every activity forces the team to think through the work, so gaps show up during planning instead of during execution.
- It builds ownership. When the people doing the work estimate it, they are far more likely to commit to it and to raise problems early.
- It makes the estimate defensible. When a sponsor asks why the project costs $262,000, the project manager can show exactly which activities drive the number.
- It creates the baseline you will track against. The same activities and work packages become the cost baseline and the schedule you use to measure progress.
Breaking work down also counters a well-known bias. People underestimate whole tasks more than they underestimate the pieces of those tasks, so estimating smaller pieces usually produces larger and more realistic totals.
Real-life example
Students who planned their thesis still finished weeks late
In a 1994 study, Buehler, Griffin and Ross asked psychology students when they expected to finish their senior thesis. Their average prediction was 33.9 days, and even their “everything goes wrong” prediction averaged 48.6 days. The real average was 55.5 days, and only about 30% finished on time. Later research found that the time people give a whole task is smaller than the sum of the times they give its subtasks, which is the effect bottom-up estimating uses.
Source: Planning fallacy (Wikipedia)
Numbers that matter
- 45%average budget overrun of large IT projects (over $15 million) in a study of more than 5,400 IT projectsSource: McKinsey and University of Oxford
- 56%less value than predicted delivered by those same large IT projects, which also ran 7% over timeSource: McKinsey and University of Oxford
How to Do Bottom-Up Estimating in 6 Steps
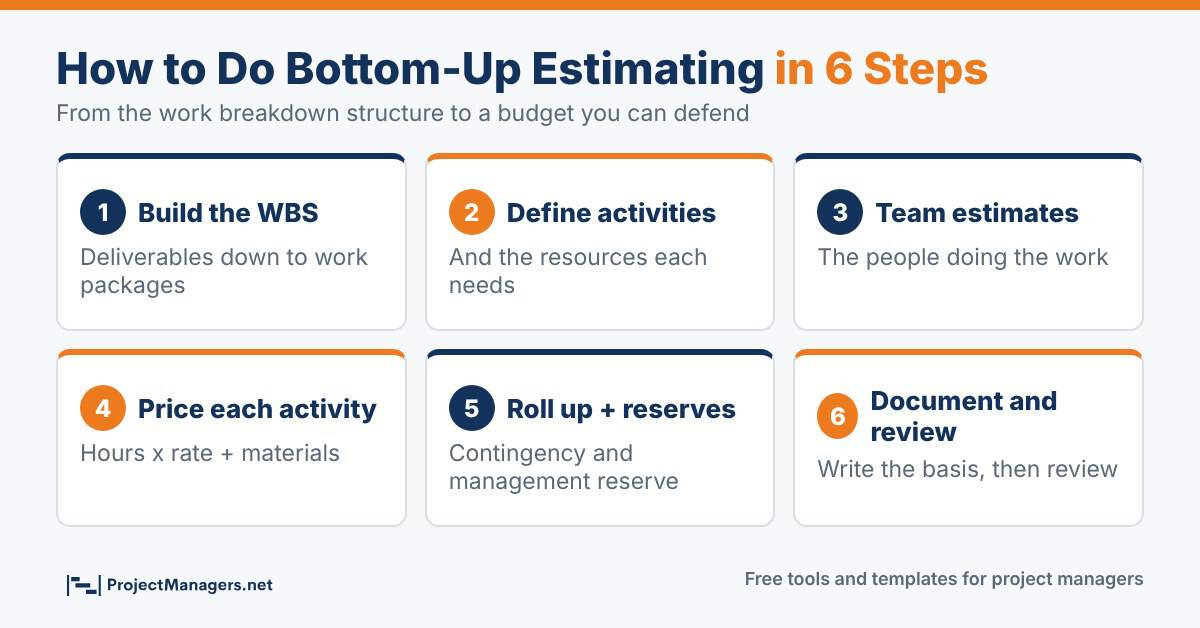
Bottom-up estimating has several connected steps. Duration, cost and resources depend on each other, so a change in one affects the others. The Project Management Institute describes the foundation as two processes: creating a work breakdown structure and defining the project activities. The six steps below build on that foundation.
1. Build the Work Breakdown Structure
Decompose the project scope into deliverables, then into work packages. A good WBS follows the 100% rule: it includes all of the work in the project scope and nothing outside it, so the children of each element add up to exactly that element. Mind maps and sticky notes work well for a first pass, and our free work breakdown structure templates give you a starting structure.
A common guideline is the 8/80 rule: a work package should take between 8 and 80 hours of effort. Smaller packages create admin overhead; larger ones hide too much uncertainty to estimate well. It is a rule of thumb, not a standard, so adapt it to the size of your project.
2. Define Activities and Their Resources
List the activities inside each work package and the resources each one needs: the role or person, materials, equipment, licences and fees. Note the role rather than only a name, because rates and availability depend on the role. Our free resource planning templates help you see who is available and when.
3. Have the People Doing the Work Estimate It
Assign each activity to the person or team lead who knows the work best, and use a RACI chart or responsibility assignment matrix to make that clear. Estimates from the people who will do the work are more realistic and easier to defend, and the estimators feel accountable for them.
Project managers usually collect team estimates in one of three ways:
- Individual estimates: each team member estimates their own activities. This is fast and builds ownership.
- Draft and review: the project manager drafts a plan with first-pass numbers and the team corrects it. This works well when the team is busy, as long as people really challenge the numbers.
- Group estimating: the team estimates together, for example with planning poker or a workshop. This takes longer but surfaces disagreement and hidden assumptions.
For activities with real uncertainty, ask for three numbers (optimistic, most likely and pessimistic) instead of one, and combine them with the PERT formula. That turns a guess into a range you can plan around.
4. Price Each Activity
Turn each estimate into money: hours multiplied by the hourly rate for that role, plus materials, equipment, travel, licences and fees. Use loaded rates (salary plus benefits and overhead) or contractor rates, and say which one you used. Write down the unit and the currency so nobody mixes days with hours or one currency with another.
5. Roll Up the Estimates and Add Reserves
Add the activities to get work package totals, add the work packages to get deliverable totals, and add the deliverables to get the base estimate for the project. Then refine the numbers with expert judgment, lead and lag analysis for the schedule, and reserve analysis:
- Contingency reserve: money and time for known risks, usually sized by how confident the estimators are. It is part of the cost baseline.
- Management reserve: money for unknown unknowns. It sits outside the cost baseline but inside the total project budget, and the sponsor normally controls it.
6. Document the Basis of Estimate and Review It
Record who estimated each activity, the assumptions they made, the rates used, what is excluded, and the confidence level. This basis of estimate is what lets you defend the number, handle change requests through integrated change control, and estimate the next project faster. Before you commit, compare the bottom-up total with a quick top-down or analogous estimate: a large gap means something is missing or padded.
Bottom-Up Estimate Builder: Build Your Estimate
Use the free builder below to create your own bottom-up estimate. Add your deliverables, list the activities under each one, and enter the hours, rate and other costs your team gives you. The builder rolls everything up, adds contingency based on how confident each estimator is, adds a management reserve, and checks for oversized activities and missing estimators. The home construction example from this guide is loaded so you can see how it works.
Bottom-Up Estimate Builder
List each deliverable, break it into activities, and enter the hours, rate and other costs your team gives you. The builder rolls everything up, adds contingency by confidence and a management reserve, and flags weak spots. The home construction example below is loaded so you can see how it works.
Bottom-Up Estimating Example: A Home Construction Project
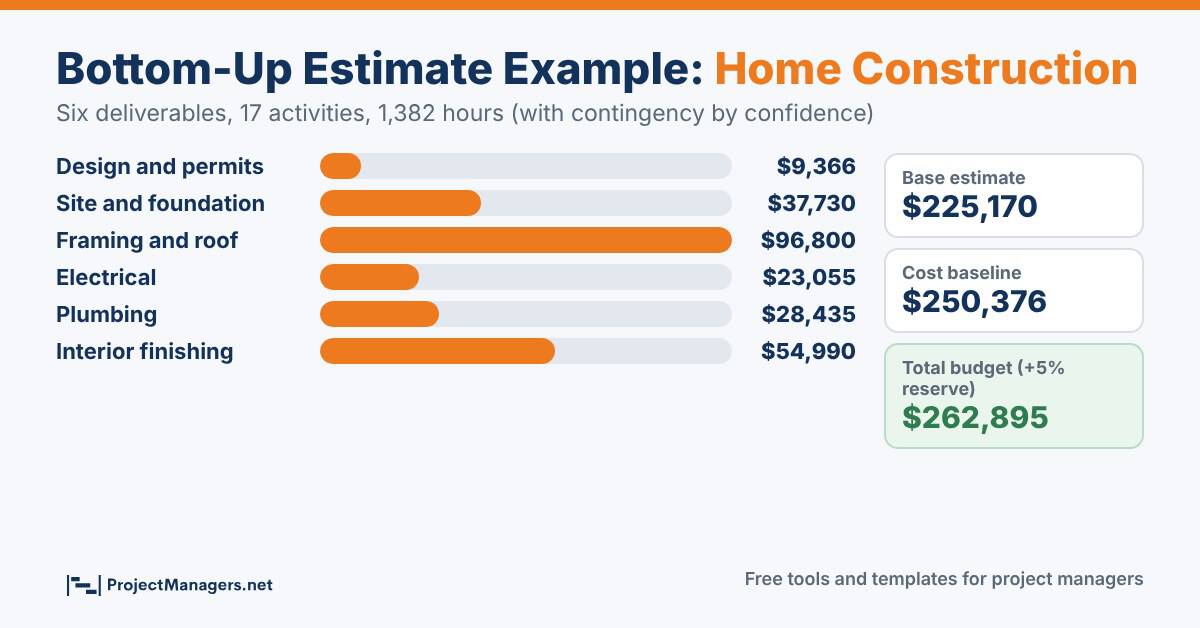
Imagine you are the project manager for a two-storey family home. You split the work into six deliverables: design and permits, site and foundation, framing and roof, electrical, plumbing, and interior finishing. Each deliverable is broken into activities. The electrical work, for example, includes rough-in wiring, panel installation, outlets and switches, and the final inspection.
Each trade lead estimates the hours and materials for their own activities and says how confident they are. Contingency is then added by confidence: 5% for high, 10% for medium and 20% for low. The figures below are illustrative, not quotes for a real build.
Electrical deliverable: activity level
How the four electrical activities roll up into one deliverable total.
| Activity | Hours x rate | Materials | Confidence | Total with contingency |
|---|---|---|---|---|
| Rough-in wiring | 80 h x $90 = $7,200 | $4,500 | Medium (10%) | $12,870 |
| Panel installation | 16 h x $90 = $1,440 | $2,200 | High (5%) | $3,822 |
| Outlets and switches | 40 h x $90 = $3,600 | $1,800 | High (5%) | $5,670 |
| Final inspection | 4 h x $90 = $360 | $300 | High (5%) | $693 |
| Electrical total | 140 h, $12,600 labor | $8,800 | $1,655 contingency | $23,055 |
Repeat the same roll-up for every deliverable and you get the project view:
Project roll-up: deliverable level
| Deliverable | Effort | Base estimate | Contingency | Total |
|---|---|---|---|---|
| Design and permits | 72 h | $8,920 | $446 | $9,366 |
| Site and foundation | 160 h | $34,300 | $3,430 | $37,730 |
| Framing and roof | 460 h | $85,900 | $10,900 | $96,800 |
| Electrical | 140 h | $21,400 | $1,655 | $23,055 |
| Plumbing | 130 h | $25,850 | $2,585 | $28,435 |
| Interior finishing | 420 h | $48,800 | $6,190 | $54,990 |
| Cost baseline | 1,382 h | $225,170 | $25,206 | $250,376 |
Base estimate $225,170 + contingency $25,206 = cost baseline $250,376. Adding a 5% management reserve ($12,519) gives a total project budget of $262,895. Load the same example in the builder above to change any number.
Two things stand out for the project manager. First, framing and roof make up 38% of the base estimate, so that deliverable deserves the closest review. Second, seven activities are well over 80 hours. Splitting the framing work into floor framing, wall framing and sheathing, for example, would give smaller pieces that are easier to estimate, assign and track.
Bottom-Up vs Top-Down vs Parametric vs Three-Point Estimating
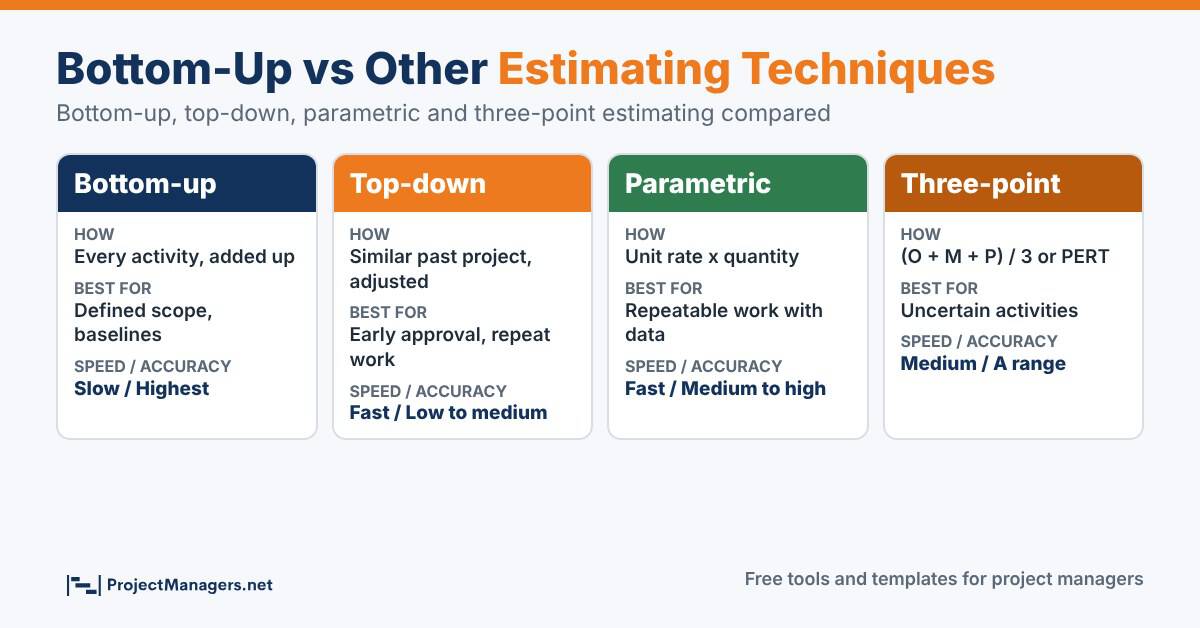
Bottom-up estimating is one of several techniques project managers use, and most projects combine more than one. Here is how they compare:
Estimating techniques compared
| Technique | How it works | Best for | Speed | Accuracy |
|---|---|---|---|---|
| Bottom-up | Estimate every activity, then add them up | Defined scope, new or complex work, budgets and baselines | Slow | Highest when the WBS is complete |
| Top-down (analogous) | Start from the cost of a similar past project and adjust | Early approval, repeat projects, go or no-go decisions | Fast | Low to medium |
| Parametric | Multiply a unit rate by a quantity (cost per square foot, hours per screen) | Repeatable work with good historical data | Fast | Medium to high, if the model is sound |
| Three-point | Combine optimistic, most likely and pessimistic values | Uncertain activities, schedule and cost risk | Medium | Gives a range, not just one number |
Bottom-up and three-point work well together: use three-point estimates for the uncertain activities inside a bottom-up estimate.
Bottom-Up vs Top-Down Estimating
Top-down estimating works in the opposite direction. The project manager starts from a total, usually based on a similar past project, and splits it down across the work. It is used early, when the scope has not yet been broken into work packages, and on repeat projects where reliable history exists. For example, if a similar project cost $100,000 last year and the new scope is comparable, $100,000 adjusted for inflation and differences is a reasonable starting point.
Top-down estimates are fast and cheap, but they carry more uncertainty, and they break down when the new project differs in scope, complexity or context from the one you compared it with. Many project managers use a top-down estimate to get approval to plan, then replace it with a bottom-up estimate once the WBS is ready.
Bottom-Up vs Parametric Estimating
Parametric estimating uses a statistical relationship between a quantity and its cost or effort. If 100 square feet of wall must be painted at $5 per square foot, the estimate is 100 x $5 = $500. Once the model and unit rates are proven, the same approach scales quickly to similar projects, and it is easy for stakeholders to follow.
The weakness is the model. Parametric estimates depend on reliable historical data, and an error in the unit rate or the formula is repeated everywhere it is used. Bottom-up estimates often use parametric figures for individual activities, such as hours per screen or cost per metre of cable, and add them up.
Bottom-Up vs Three-Point Estimating
Three-point estimating asks for three values per activity: optimistic (O), most likely (M) and pessimistic (P). There are two common formulas:
- Triangular (simple average): E = (O + M + P) / 3
- PERT (beta): E = (O + 4M + P) / 6, which gives more weight to the most likely value. See our PERT formula page for worked examples and a calculator.
The PMBOK Guide uses tE, tO, tM and tP for duration and cE, cO, cM and cP for cost. For an activity with an optimistic estimate of 11 days, a most likely estimate of 14 days and a pessimistic estimate of 20 days:
Three-point estimate example
| Estimate | Duration | Calculation |
|---|---|---|
| Optimistic (O) | 11 days | Best case |
| Most likely (M) | 14 days | Normal conditions |
| Pessimistic (P) | 20 days | Worst realistic case |
| Triangular estimate | 15 days | (11 + 14 + 20) / 3 |
| PERT estimate | 14.5 days | (11 + 4 x 14 + 20) / 6 = 87 / 6 |
Three-point estimating is not a replacement for bottom-up estimating. It is a way to estimate each activity more honestly. It still depends on the judgment of the people giving the three numbers, and poorly chosen values produce a precise-looking but wrong result.
Pros and Cons of Bottom-Up Estimating
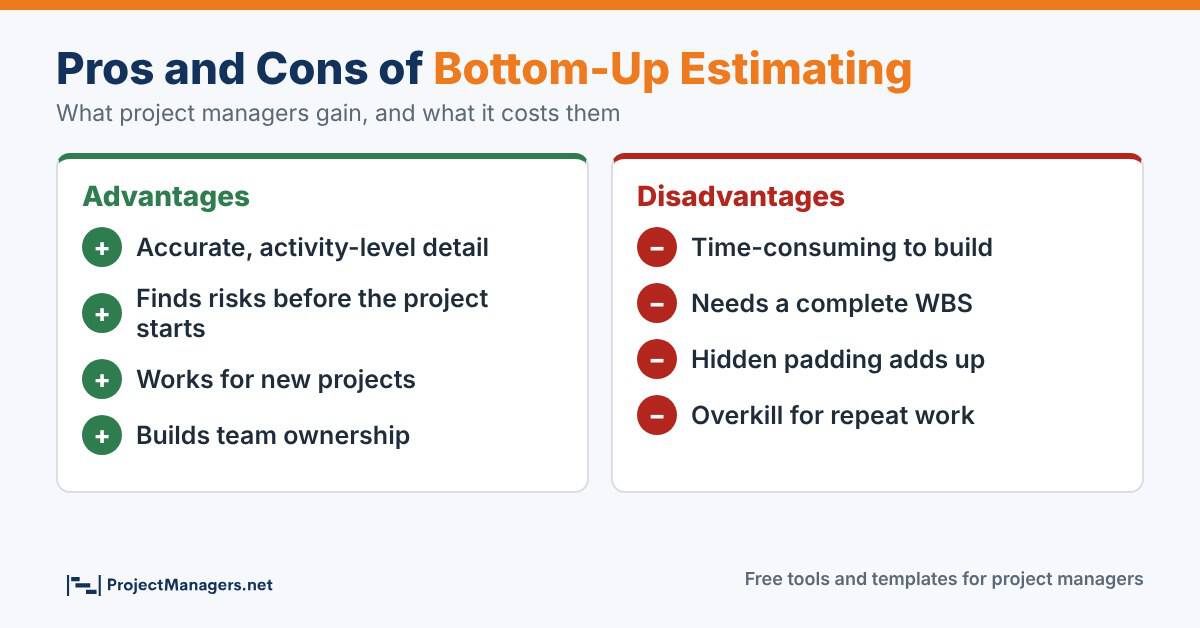
Advantages of Bottom-Up Estimating
- Accuracy: estimates come from the people who will do the work and are based on specific activities, not on averages from other projects.
- Early risk detection: estimating each activity shows where the cost and schedule risks are before the project starts.
- Works for new projects: it does not need historical data from a similar project, so it suits work that is new to the organization.
- Team buy-in: people commit more readily to estimates they made themselves.
- A ready-made baseline: the estimate becomes the cost baseline and the structure for tracking progress and earned value.
Disadvantages of Bottom-Up Estimating
- Time-consuming: estimating every activity takes significant time and coordination from the project manager and the team.
- Needs a complete WBS: it cannot start until the scope is defined, and anything missing from the WBS is missing from the budget.
- Padding adds up: if every estimator quietly adds a safety margin, the margins compound into a bloated total. Ask for honest estimates and hold contingency at the project level instead.
- Errors compound too: small, consistent errors in rates or assumptions grow when hundreds of activities are summed.
- Overkill for repeat work: when reliable history exists and projects follow a repeatable pattern, the extra effort may not buy much extra accuracy.
Real-life example
Detailed plans still miss when the whole project is new
Bent Flyvbjerg and Dan Gardner reviewed a database of 16,000 projects in Harvard Business Review. Only 8.5% hit their original cost and schedule targets, and just 0.5% delivered on cost, schedule and benefits. Their advice for project managers is to plan slowly and in detail before committing, and to check the plan against the actual results of similar past projects (the outside view), because a detailed inside view alone tends to be optimistic.
Numbers that matter
- 8.5%of 16,000 projects met their original cost and schedule targetsSource: Flyvbjerg and Gardner, Harvard Business Review
- 0.5%delivered on cost, schedule and the benefits promisedSource: Flyvbjerg and Gardner, Harvard Business Review
When Should Project Managers Use Bottom-Up Estimating?
Use bottom-up estimating when:
- The scope is defined well enough to build a WBS down to work packages.
- You need a budget or schedule baseline that will be approved, contracted or audited.
- The project is new to the organization, complex or high-stakes, so there is no reliable history to copy.
- You need to know exactly which resources are required and when.
Use a faster technique, such as a SWAG estimate, top-down, parametric or T-shirt sizing, when the scope is still vague, when you only need a rough figure for a go or no-go decision, or when the project closely repeats one you have delivered before. Many project managers use both: a quick top-down number early, then a bottom-up estimate once the WBS exists, with the two compared as a sanity check.
Free Bottom-Up Estimate Template (Excel)
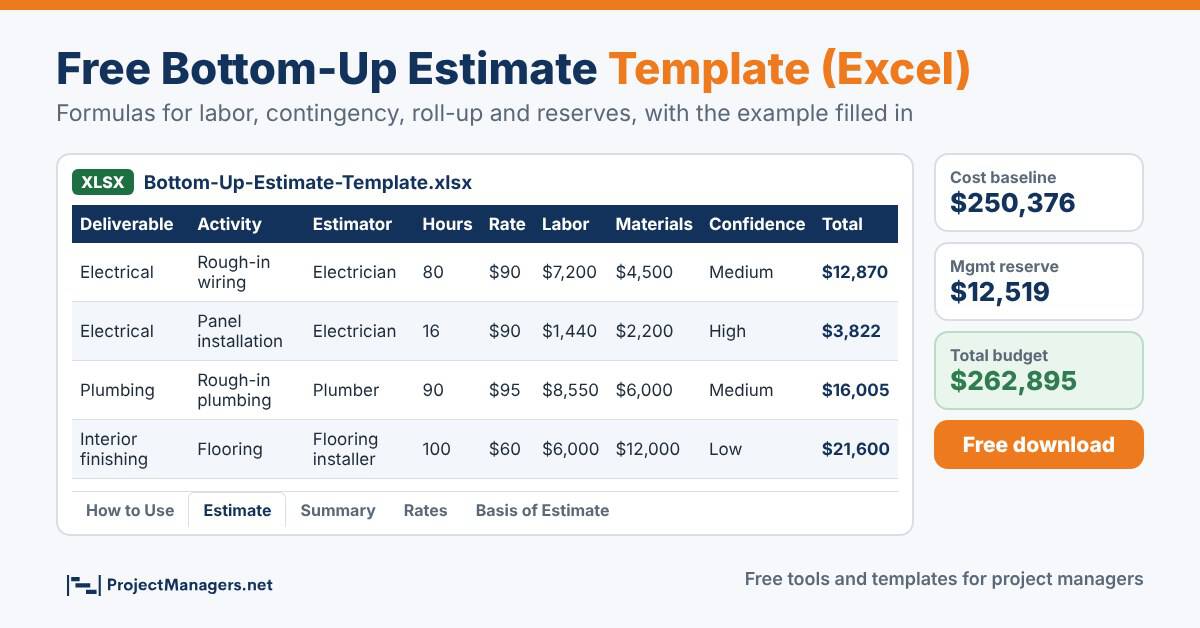
Prefer a spreadsheet? Download our free bottom-up estimate template. It includes an Estimate sheet with built-in formulas for labor, contingency and totals, a Summary sheet that rolls the estimate up by deliverable and adds the management reserve, a Rates sheet, and a Basis of Estimate log for assumptions and exclusions. The home construction example is filled in so you can replace it with your own project.
Bottom-Up Estimate Template (Excel)
Download the free templateBottom-Up Estimating Quiz
10 questions on bottom-up estimating
Check what you learned. Pick an answer, then open the answer to see if you were right.
What does bottom-up estimating add together to get the project estimate?
- APast project totals
- BThe estimates of the lower-level WBS components
- CUnit rates multiplied by quantities
- DThe sponsor’s budget
Show answer
Answer B. The PMBOK Guide defines bottom-up estimating as aggregating the estimates of the lower-level components of the WBS.
What must exist before you can build a reliable bottom-up estimate?
- AA signed contract
- BA risk register
- CA work breakdown structure
- DA Gantt chart
Show answer
Answer C. The WBS is the starting point. Work that is not in the WBS is not in the estimate.
Who should ideally estimate each activity?
- AThe sponsor
- BThe person or team who will do the work
- CThe finance department
- DAn outside consultant
Show answer
Answer B. The people doing the work know it best, and estimating it builds their ownership.
What does the 100% rule of the WBS say?
- AEvery task needs 100% of its budget up front
- BThe WBS includes all of the scope and nothing outside it
- CResources must be 100% allocated
- DEstimates must be 100% accurate
Show answer
Answer B. The children of each WBS element add up to 100% of that element, and the WBS covers 100% of the project scope.
What is the 8/80 rule?
- AWork packages should take between 8 and 80 hours
- BProjects need 8 deliverables and 80 activities
- CReserves should be 8% to 80%
- DTeams should have 8 to 80 members
Show answer
Answer A. It is a common guideline for sizing work packages, not a formal standard.
Where does the management reserve sit?
- AInside each activity estimate
- BInside the cost baseline
- COutside the cost baseline but inside the project budget
- DIt is not part of the budget
Show answer
Answer C. Contingency reserves are in the cost baseline; management reserve is added on top to give the total project budget.
Using PERT, what is the estimate for O = 11, M = 14, P = 20 days?
- A14.5 days
- B15 days
- C14 days
- D16 days
Show answer
Answer A. (11 + 4 x 14 + 20) / 6 = 87 / 6 = 14.5 days. The simple average would give 15 days.
Which technique is best for a quick go or no-go decision on a project similar to a past one?
- ABottom-up
- BTop-down (analogous)
- CEarned value
- DMonte Carlo
Show answer
Answer B. Top-down estimates are fast and use the cost of a similar past project.
What is a main disadvantage of bottom-up estimating?
- AIt cannot be used for cost
- BIt ignores the team
- CIt is time-consuming and needs a complete WBS
- DIt only works for software
Show answer
Answer C. Detailed estimates take time and depend on well-defined scope.
Why can padding be a problem in bottom-up estimates?
- APadding is not allowed by PMI
- BHidden margins on many activities add up to an inflated total
- CIt reduces the number of activities
- DIt makes the WBS smaller
Show answer
Answer B. Small safety margins on every activity compound. Hold contingency openly at the project level instead.
Video: Bottom-Up Estimation Explained
Watch this short video for a visual walkthrough of bottom-up estimation: how to break the project work down, estimate at the activity level, and roll the estimates up into an overall project forecast.
Video: What is Bottom up Estimation? (YouTube)
Bottom-Up Estimating Facts Worth Checking
Common claims about bottom-up estimating, checked against the sources.
| Claim | Verdict | What the source says |
|---|---|---|
| Bottom-up estimating adds up the estimates of lower-level WBS components | True | This is the PMBOK Guide definition of the technique. PMI PMBOK Guide |
| Bottom-up is always the most accurate estimating technique | Partly true | It is usually the most detailed, but GAO notes errors can compound and items can be left out, and Flyvbjerg recommends checking detailed plans against similar past projects. GAO Cost Estimating and Assessment Guide |
| A detailed estimate can reach -3% to +15% accuracy | True | AACE gives Class 1 estimates, built from detailed take-offs on a 65% to 100% defined project, an expected range of -3% to -10% low and +3% to +15% high. AACE 18R-97 summary (EPCLand) |
| You can add activity durations to get the project duration | False | Only for effort and cost. Activities that run in parallel overlap, so duration comes from the network diagram and the critical path. |
| Work packages must be between 8 and 80 hours | Partly true | The 8/80 rule is a widely used guideline, not a PMI requirement. Adjust it to the size of the project. |
| Three-point estimating always uses (O + 4M + P) / 6 | False | That is the PERT (beta) formula. The triangular formula is (O + M + P) / 3. Both are three-point estimates. |
| Breaking tasks into subtasks gives larger, more realistic estimates | True | Research on the planning fallacy found that the time given to a whole task is smaller than the sum of the times given to its subtasks. Planning fallacy (Wikipedia) |
| People finish on time when they plan carefully | False | In the Buehler, Griffin and Ross study, students predicted 33.9 days on average and took 55.5; only about 30% finished on time. Planning fallacy (Wikipedia) |
| Management reserve is part of the cost baseline | False | Contingency reserves are in the cost baseline. Management reserve is added on top to form the total project budget. PMI PMBOK Guide |
| Large IT projects overrun their budgets by 45% on average | True | McKinsey and the University of Oxford found this for IT projects over $15 million, in a study of more than 5,400 projects published in 2012. McKinsey and University of Oxford |
Checked November 9, 2026.
Conclusion
Bottom-up estimating remains one of the most reliable techniques a project manager can use, because it builds the estimate from the work itself. Break the project down with a complete WBS, let the people closest to the work estimate it, price each activity, roll the numbers up, and add contingency and management reserve openly instead of hiding them in every line.
For complex, high-stakes or unfamiliar projects, the time it takes is well spent. You get a more accurate budget and schedule, a team that owns its numbers, earlier warning of risks, and a baseline you can track the project against. Start with the free Bottom-Up Estimate Builder or the Excel template above, and compare your total with a quick top-down estimate before you commit.
Bottom-Up Estimating FAQ
What is bottom-up estimating in project management?
Bottom-up estimating is a technique where the project is broken down into its smallest parts with a work breakdown structure, the people responsible estimate each activity, and the estimates are added up to get the total cost, effort or resource needs of the project.
How do you calculate a bottom-up estimate?
Build the WBS, list the activities in each work package, estimate the hours, rates and other costs for each activity, then add activities into work packages, work packages into deliverables, and deliverables into the project base estimate. Add contingency to get the cost baseline and a management reserve to get the total project budget.
What is the most accurate method of estimation in project management?
Bottom-up estimating is usually the most detailed and accurate technique once the scope is well defined, because every activity is estimated by the people who know the work. It is still only as good as the WBS, so many project managers cross-check it with a top-down estimate or with results from similar past projects.
When should you avoid bottom-up estimating?
Avoid it when the scope is still too vague to break into work packages, when you only need a rough figure for a quick decision, when there is no time to plan in detail, or when the project closely repeats past work with reliable historical data.
What is the difference between bottom-up and top-down estimating?
Bottom-up estimating starts with individual activities and adds them up. Top-down estimating starts with a total, usually based on a similar past project, and divides it across the work. Top-down is faster and used early; bottom-up is slower but more accurate once scope is defined.
What are the main estimating techniques used in project management?
The most common are bottom-up, top-down (analogous), parametric and three-point estimating, with PERT being the weighted form of three-point estimating. Agile teams also use relative techniques such as story points and T-shirt sizing, and early ideas are often sized with a SWAG estimate.
Suggested articles:
- Top-Down and Bottom-Up Estimates Comparison
- PERT Formula Examples and PERT Calculator
- Why the Discovery Phase Is Critical for Successful Project Delivery
- Free Resource Planning Templates
- SWAG Estimates in Project Management

Shane Drumm, holding certifications in PMP®, PMI-ACP®, CSM, and LPM, is the author behind numerous articles featured here. Hailing from County Cork, Ireland, his expertise lies in implementing Agile methodologies with geographically dispersed teams for software development projects. In his leisure, he dedicates time to web development and Ironman triathlon training. Find out more about Shane on shanedrumm.com and please reach out and connect with Shane on LinkedIn.