
Organizations have never had more information about their own operations, and they have never been less certain about what to do with it. Transaction records, customer interactions, sensor readings, application logs, and countless other digital traces pile up continuously across departments and systems, yet most of it sits unexamined, unconnected, and effectively invisible to the people making decisions.
The gap between having data and using it has become one of the clearest dividing lines between companies that adapt quickly and companies that keep making decisions the way they always have.
Building the Technical Foundation for Analytics Work
Turning raw data into something a business can act on requires specific technical skill rather than general comfort with numbers. Candidates can pursue a Master’s in Data Analytics online from Northwest Missouri State University that covers identifying, collecting, analyzing, and transforming data, with hands-on practice in programming languages including Python and SQL.
The program is built around real-world application rather than theory alone. Students work through data cleaning, statistical evaluation, visualization, machine learning, and streaming data, finishing with a capstone project applied to an actual dataset.
What Companies Are Actually Trying to Solve
The business problems driving demand are unglamorous and specific. A retailer wants to know which inventory to stock where. A lender wants to identify which applications carry risk. A hospital system wants to predict which patients are likely to return within thirty days. A manufacturer wants to know which machine is about to fail.
Each of these is answerable with data the organization already collects. What is usually missing is someone who can locate the relevant data, clean it into a usable shape, apply an appropriate method, and explain the result to people who will act on it. That last part gets underestimated constantly.
The volume problem is real too. Data arrives faster than anyone can review it manually, from sources that did not exist a decade ago. Systems that process information as it arrives, rather than in overnight batches, have become standard in industries where a delayed answer is a useless answer.
The Work Behind the Insight
Most people imagine analytics as building models. In practice, the majority of the effort goes into everything that happens before modeling. Finding the data is step one, and it is rarely simple. Information lives in different systems owned by different teams, stored in different formats, with different definitions of what should be the same field.
Two departments will report different revenue numbers for the same quarter, and reconciling that is data analytics work. Cleaning consumes more time than anything else. Missing values, duplicate records, inconsistent formatting, entries that are obviously wrong but not automatically detectable: all of it has to be handled before analysis means anything.
Skipping this step produces confident answers that are simply false. Then comes choosing a method appropriate to the question. Not every problem needs a sophisticated model. Sometimes a well-constructed summary answers the question better and faster, and knowing when to reach for the simple tool is a mark of experience.
Communication as a Technical Skill
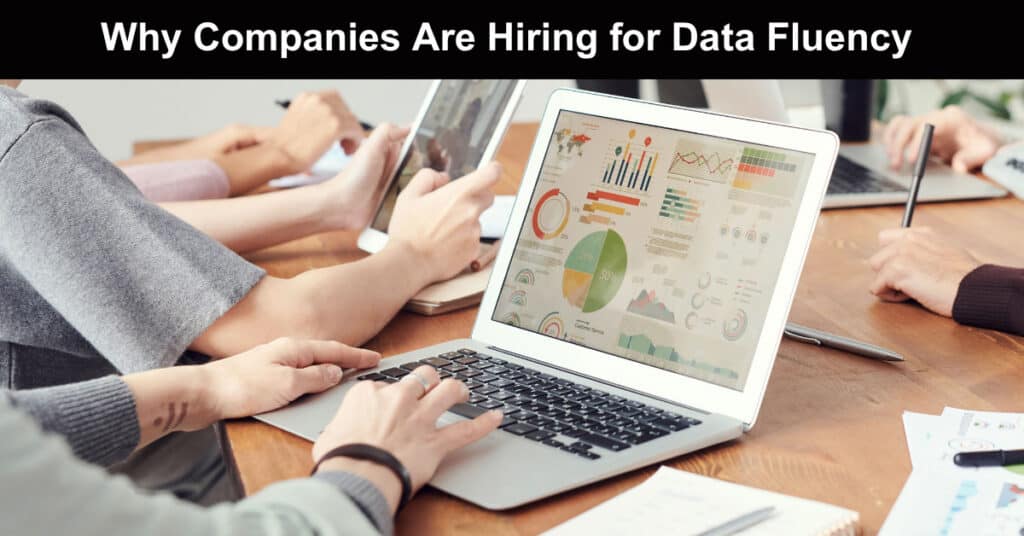
Analysis that nobody acts on has produced nothing. The most consistently undervalued capability in this field is the ability to present findings so that a decision-maker understands them and trusts them. Visualization does much of this work. A chart that makes the pattern obvious accomplishes more than a table of correct numbers.
Good visual design here is not decoration; it is the difference between a finding that lands and one that does not. Framing matters equally. Executives want to know what to do, not how the analysis was performed. Leading with the recommendation and keeping methodology available but secondary is usually the right structure, even though it feels backward to people trained to build arguments from evidence forward.
Honesty about uncertainty is the third piece. Every analysis has limits, and stating them plainly builds the credibility that makes future recommendations carry weight. Analysts who acknowledge what they don’t know are trusted more, not less, the next time they present a finding.
Where the Roles Are
Job titles in this space are inconsistent, which makes searching harder than it should be. The same work appears under data analyst, business intelligence analyst, reporting analyst, management analyst, and half a dozen other labels depending on the industry and the size of the organization.
Financial services hire heavily for risk assessment, fraud detection, and portfolio analysis. Healthcare organizations need people who can work with clinical and operational data under strict privacy constraints. Retail and logistics run on demand forecasting and supply chain optimization. Government agencies employ analysts across public safety, transportation, and program evaluation.
The size of the employer changes the job substantially. At a small company, one person may handle everything from database maintenance through executive presentations. At a large one, the work is divided among specialists, and an analyst may focus narrowly on a single domain for years.
Choosing How to Prepare
Self-teaching is genuinely possible in this field, and plenty of working analysts got there through online courses, personal projects, and stubbornness. It works best for people who already have adjacent technical skills and a clear sense of what to learn next.
Structured programs offer things that are hard to assemble alone: sequencing that builds concepts in a sensible order, feedback on work from people who know the field, and a credential that gets past hiring filters. For career changers without a technical background, that structure usually matters more than it does for someone already working in a technical role.
Whichever route, portfolio work decides hiring outcomes. A candidate who can walk through a project they built, explain the choices they made, and discuss what they would do differently demonstrates something no transcript conveys. Employers want evidence that a person has actually wrestled with messy data and produced something useful from it.
Conclusion
The demand is real, and the work is genuinely interesting for people who like solving puzzles with practical consequences that affect real decisions and real outcomes. What it asks in return is patience with the unglamorous parts, like cleaning messy records, plus a willingness to keep learning new tools and techniques that will likely be replaced within five years.
Suggested articles:
- Choosing the Right Data Visualization Tools for Better Project Decisions
- Data-Driven Decision-Making in Project Management
- 3 Tech Trends That Will Dominate the Data Analytics Sector in 2026

Daniel Raymond, a project manager with over 20 years of experience, is the former CEO of a successful software company called Websystems. With a strong background in managing complex projects, he applied his expertise to develop AceProject.com and Bridge24.com, innovative project management tools designed to streamline processes and improve productivity. Throughout his career, Daniel has consistently demonstrated a commitment to excellence and a passion for empowering teams to achieve their goals.