
Trello has long been a go-to tool for project teams that favor visual task management and flexible collaboration. However, one of the most frequently requested features from its users—especially project managers and operations teams—has been a Gantt Chart view for Trello. Until recently, Trello lacked built-in support for this timeline-style visualization, which made scheduling and managing large-scale or time-sensitive projects a bit more challenging.
Now, with the integration of Bridge24, Trello users can finally access a powerful and customizable Gantt Chart view, offering comprehensive planning capabilities across all Trello Boards. Whether you’re managing a product launch, event planning calendar, content pipeline, or agile sprint backlog, the Gantt view in Bridge24 brings clarity and control to your workflow.
Why Gantt Charts Matter in Project Management
Gantt charts are essential tools for visualizing task timelines, dependencies, and overall project progress. Unlike a typical Kanban board or list view, Gantt charts allow users to:
- See how tasks overlap over time
- Identify potential bottlenecks
- Adjust timelines dynamically
- Allocate resources efficiently
- Monitor deadlines and milestones in one place
These benefits are particularly important in multi-phase projects where coordination between teams or dependencies between tasks must be managed carefully. With Trello’s recent improvements—such as introducing the native Start Date field—teams now have more flexibility than ever. Bridge24’s Gantt view builds on that functionality and adds layers of power and customization.
Introducing the Bridge24 Gantt Chart for Trello
Bridge24 is a project reporting and export tool that works with Trello, Asana, Basecamp, and Jira. For Trello users, it offers enhanced views such as calendars, grids, and now, Gantt charts.
Key Benefits of Bridge24’s Gantt Chart View:
- Use Any Date Field: Select from Due Date, Start Date, or even custom date fields to define your task timelines.
- Multiple Boards Support: Visualize projects across one or multiple Trello Boards simultaneously.
- Real-Time Filtering: Instantly filter tasks by label, user, status, or custom field for focused planning.
- Interactive Drag & Drop: Move tasks along the timeline directly in the Gantt chart.
- PDF Export: Share your project status with stakeholders in a clean, printable format.
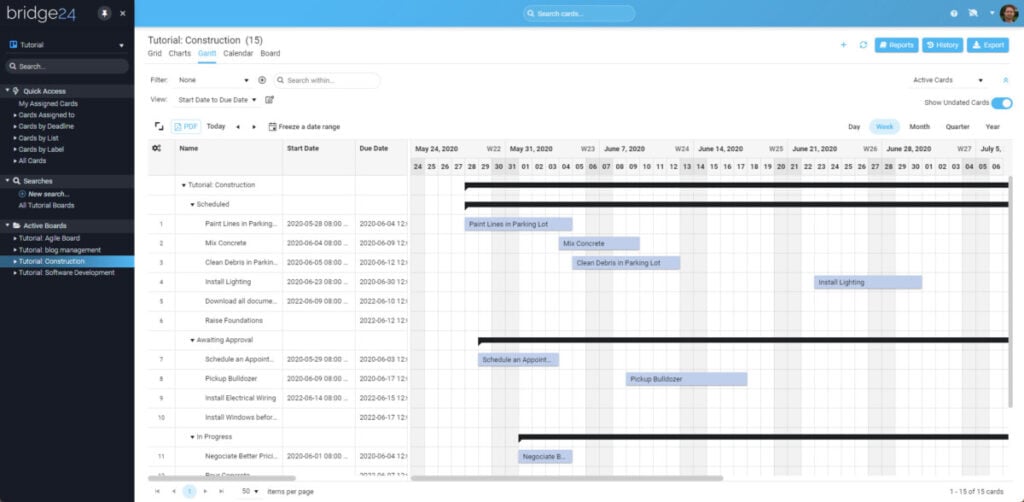
Trello Gantt Chart View Usage
Traditionally, Trello has lacked a native way to view tasks over time. Although Power-Ups like Timeline view helped somewhat, they often required paid Business Class subscriptions and were limited in flexibility. Bridge24 bridges that gap. Even before Trello added the Start Date field, Bridge24 allowed users to use any date as the beginning or end of a task’s duration.
This flexibility remains a strong selling point, especially for those who use custom fields or need to track alternative timelines (like review periods or QA deadlines).
You can now:
- Select start and end dates from any field
- Use a single “punctual” date to mark fixed events
- Create project views that reflect actual workstreams, not just due dates
Setting Up Your Gantt Chart View

To set up your Gantt view in Bridge24 for Trello, follow these steps:
- Select Your Boards: Choose one or more Trello Boards to display.
- Choose Your Date Fields:
- Use native Trello fields like Start Date and Due Date
- Or map custom fields if your team tracks special milestones
- Define Your View Settings:
- Group by Board, List, or both
- Collapse/expand groups for easier navigation
- Adjust Display Settings:
- Modify column visibility in the Grid view
- Resize the Grid and Gantt sections using the draggable divider
This intuitive setup makes it easy to create a high-level overview or drill into specific project segments.
Dynamic Filtering & Interaction
Bridge24’s Gantt chart is not static—it’s built for interactivity. Dynamic filtering lets users zero in on exactly what they need, saving time and avoiding clutter.
You can filter by:
- Card title or keyword
- Assigned team members
- Labels or tags
- Checklist completion status
- Custom field values
Additionally, all Gantt bars are interactive. Need to reschedule a task? Simply drag the bar to a new position. Want to change duration? Extend or shorten the bar visually. To apply any date changes made, just click the Refresh icon to sync your updates.
Milestones, Dependencies & Timeline Precision
Bridge24’s Gantt view also supports key project planning elements like:
- Milestones: Mark specific cards with clear endpoint visuals to denote major achievements or deadlines.
- Dependencies (coming soon): While not yet fully live, the Bridge24 team has announced that dependency mapping between tasks is in beta for selected users.
- Date Bar Customizations: Cards with only end dates still appear with fixed milestone markers, so you don’t lose visibility on fixed tasks.
Exporting Your Trello Gantt to PDF
Sharing progress with clients, executives, or cross-functional teams? You’ll love the ability to export the Gantt chart as a PDF.
Export Steps:
- Click the PDF icon at the top left of the Gantt view.
- Adjust your filtered view to avoid exceeding the maximum dimension.
- Generate and download your PDF report.
Note: If your chart has too many tasks or spans too much time, the export may be too large. Use filters to reduce the scope for clean output.
Use Cases Across Industries
Bridge24’s Gantt integration is especially valuable for:
- Agencies: Plan client campaigns, track deliverables, and report progress.
- Construction: Align field operations with deadlines and supplier timelines.
- Education: Manage semester schedules, exam preparations, or course content rollout.
- Tech Teams: Map agile sprints, backlog grooming, Q and A testing windows.
- Event Planners: Visualize event buildouts, vendor timelines, and promo schedules.
Why Gantt Chart View for Trello Via Bridge24 Matters
The Gantt chart view for Trello via Bridge24 transforms a basic task board into a comprehensive project planning ecosystem, offering users more than just visuals—it provides actionable insights. With this tool, users can visualize the full scope of their project timelines, quickly reschedule and reprioritize work, and gain team alignment through a shared visual roadmap.
It also improves accountability by enabling teams to track task status over time and simplifies reporting with filtered exports. Whether managing small internal projects or complex multi-team operations, this tool delivers enhanced transparency and efficiency, making it an invaluable resource for project planning and execution.
Conclusion
The Trello Gantt Chart view offered by Bridge24 is a powerful addition to any project manager’s toolkit. It eliminates the limitations of standard list or card views and replaces them with a dynamic, interactive timeline visualization that reflects the realities of project execution. From assigning start and end dates to dragging tasks across a timeline, the Gantt view allows for deeper insight, faster decisions, and better team coordination.
Add PDF exports and milestone tracking into the mix, and it’s clear this is a must-have for serious Trello users. As Trello continues to evolve, integrations like Bridge24 will play a vital role in shaping the platform’s adaptability for professional-grade project management.
Suggested articles:
- Trello – Backup & Export your Documents & Files in Bulk
- Use Trello Custom Fields to Optimize Your Workflow
- Calculated Fields for Asana, Basecamp, and Trello
Daniel Raymond, a project manager with over 20 years of experience, is the former CEO of a successful software company called Websystems. With a strong background in managing complex projects, he applied his expertise to develop AceProject.com and Bridge24.com, innovative project management tools designed to streamline processes and improve productivity. Throughout his career, Daniel has consistently demonstrated a commitment to excellence and a passion for empowering teams to achieve their goals.