
Every agile team collects data, but few teams know which numbers actually predict success. Vanity metrics like raw velocity can look impressive on a dashboard while masking burnout, rework, and missed deadlines. Agile performance metrics exist to close that gap, turning sprint activity into evidence that teams and leaders can act on with confidence rather than a number reported upward without any context at all.
This guide breaks down the agile performance metrics that matter most, from lead time and cycle time to newer frameworks like DORA and SPACE that measure delivery speed alongside team health. It also covers how agile measurement differs from traditional performance reviews and where each approach falls short. Here is how to build a measurement system your team will actually trust and use.
Measuring Agile Team Performance
The term agile began in software development, but organizations across marketing, HR, sales, and operations now run agile teams of their own. These teams are defined by their ability to adapt quickly to changing priorities and ship working results in short cycles rather than waiting months for a single delivery to land on a desk.
Harris and Cooper’s Agile Team Performance Model remains a useful starting framework because it organizes measurement into four distinct areas leaders can track consistently over time. Rather than picking one number to represent an entire team, this model asks organizations to weigh delivery, quality, innovation, and agility together so no single metric distorts the full picture of how the team is actually performing.
The model breaks agile team performance into four core areas of focus:
- Delivery: How reliably the team ships completed, working increments of value on the cadence it committed to. Consistent delivery builds trust with stakeholders and creates a predictable rhythm that the rest of the organization can plan around. Teams that struggle here often face unclear priorities, scope creep, or capacity mismatches that prevent them from closing work within a sprint.
- Quality: Whether that delivered work holds up in production without generating rework, defects, or customer complaints. Quality is not just a testing concern — it is a team-wide responsibility that shows up in code reviews, definition of done agreements, and the discipline to slow down when something does not feel right before shipping it forward.
- Innovation: How often the team introduces new ideas, process improvements, or creative solutions rather than repeating the same playbook. High-performing agile teams treat retrospectives and slack time as genuine opportunities to experiment, not boxes to check. Innovation at the team level does not always mean big breakthroughs — it often shows up as small, compounding improvements to how the team works together.
- Agility: How quickly the team absorbs new information, shifting priorities, or unexpected obstacles without losing momentum. True agility goes beyond following a framework. It reflects a team’s psychological safety, its ability to communicate openly about blockers, and its willingness to adapt its approach when the original plan no longer fits the reality in front of it.
9 Agile Performance Metrics
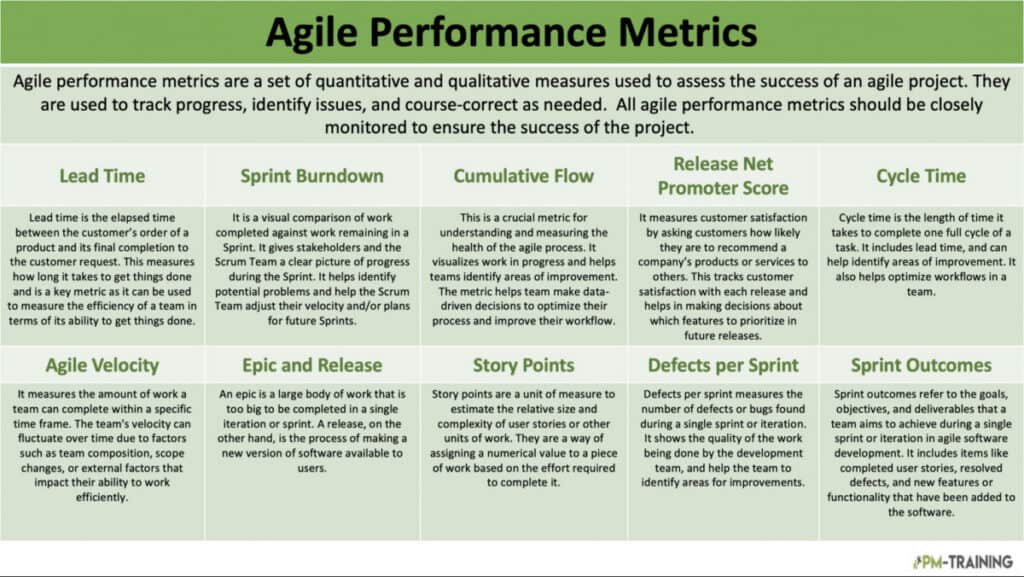
No single metric captures agile performance on its own, which is why high-performing teams track a small, deliberate portfolio of indicators instead. Delivery metrics such as lead time and cycle time reveal how fast work moves through the system, while quality metrics like defect counts show whether that speed is coming at a real cost to the customer.
Newer frameworks such as DORA and SPACE have also reshaped how mature organizations think about agile measurement in recent years. Rather than relying on a single throughput number, these frameworks pair delivery speed with stability and team wellbeing, since a team can hit sprint goals while quietly burning out behind the scenes. The agile metrics below reflect that broader, balanced approach.
1. Lead Time
Lead time measures the elapsed time between a customer request and final delivery of that work, covering the entire journey rather than just active development. It is one of the clearest indicators of how efficiently a team turns a request into value, and long lead times often point to queueing and approval delays rather than a lack of coding speed itself.
2 Sprint Burndown
A sprint burndown chart plots completed work against remaining work across the length of the sprint, giving the team and stakeholders a shared, visual read on progress. It helps a scrum team spot early warning signs, such as a flat line that signals blocked work, so they can adjust scope or capacity before the sprint ends rather than after the fact.
3. Cumulative Flow
Cumulative flow, often shown as a cumulative flow diagram or CFD, visualizes how many work items sit in each stage of the process at any given point in time. Widening bands in the middle of the chart usually signal a bottleneck, such as a review or testing stage that cannot keep pace with incoming work from earlier stages.
4. Release Net Promoter Score
Release Net Promoter Score asks customers how likely they are to recommend a product to others after a specific release, turning customer sentiment into a trackable number. Agile teams use this score to judge whether a release actually satisfied users, not just whether it shipped on schedule, and to guide which features deserve continued investment in future sprints.
5. Cycle Time
Cycle time measures how long it takes to move a single work item from the moment work actively begins to the moment it is done, and it sits inside the broader lead time window. Because cycle time excludes the waiting period before work starts, it isolates how efficiently the team executes once a task reaches the board.
6. Agile Velocity
Agile velocity measures the average amount of work, typically in story points, that a team completes per sprint, and teams use it mainly to forecast how much work fits into future sprints. Velocity was designed as a planning tool, not a performance score, and treating it as one encourages teams to inflate estimates rather than improve real delivery.
6. Epic and Release
Developers break large bodies of work into epics and releases so that big initiatives stay manageable inside short sprint cycles instead of stalling for months. An epic is a large body of related work too big to finish in one sprint, while a release bundles completed epics and stories into something ready to ship to real customers.
7. Story Points
Story points completed per sprint give teams a rough sense of how much work they can consistently deliver, which supports capacity planning for future sprints and releases. Because points reflect relative effort rather than hours, they let teams compare workload without forcing every task into a rigid time estimate that rarely holds up once real work begins.
8. Defects per Sprint
Defects per sprint tracks how many bugs or quality issues surface in the work a team ships, offering a direct check on whether speed is coming at the expense of lasting quality. A rising defect count alongside stable or improving velocity often signals the team is cutting corners on testing, peer review, or documentation somewhere along the way.
9 Sprint Outcomes
Sprint outcomes measure whether the work a team completed actually moved the product closer to its intended goals, not simply whether the assigned tickets were closed out on schedule. This shifts the conversation from output, how much got done, to outcome, whether it mattered to the customer and the wider business the team ultimately serves.
DORA Metrics and the SPACE Framework
DORA metrics and the SPACE framework represent the next stage of agile measurement, particularly for teams that ship software rather than run purely business-side agile processes. Where classic Scrum metrics focus on a single sprint, these frameworks look at delivery pipelines and human sustainability together, which is why more organizations now treat them as a natural extension of the metrics already covered above.
DORA Metrics
DORA metrics began as annual research into what separates elite software delivery teams from struggling ones, and it has since become a standard four-part measurement model. It groups performance into throughput, how fast changes move, and stability, how safely they move, treating speed and quality as connected rather than competing goals that teams must trade off against each other.
DORA groups software delivery performance into four connected measurements below:
- Deployment Frequency: How often a team releases code to production, with elite teams typically deploying on demand rather than on a fixed weekly or monthly schedule.
- Change Lead Time: The time between a code change being committed and running in production, which highlights waiting time caused by review and release bottlenecks.
- Change Failure Rate: The percentage of deployments that cause a production incident, revealing whether speed is quietly coming at the cost of stability.
- Failed Deployment Recovery Time: How quickly a team restores service after a failed deployment, which shows how resilient the delivery process really is under pressure.
SPACE Framework
The SPACE framework was introduced to fill a gap that DORA leaves open, since a team can hit every delivery target while individual engineers are quietly overworked or disengaged. It measures productivity across five dimensions rather than one, and mature organizations are expected to draw evidence from at least three of them before drawing any real conclusion.
SPACE evaluates team productivity across five interconnected dimensions listed here:
- Satisfaction and Wellbeing: How fulfilled and supported team members feel, typically gathered through short, recurring pulse surveys rather than annual engagement reviews.
- Performance: The outcomes of the work itself, judged through release quality and customer-reported issues rather than raw output volume.
- Activity: The volume of work produced, used carefully as context rather than as a standalone productivity score that invites gaming.
- Communication and Collaboration: How efficiently information flows between people, often reflected in code review turnaround time and meeting load.
- Efficiency and Flow: How smoothly work moves through the system, including how often people get interrupted or forced to switch context mid-task.
Flow Metrics and Value Stream Management
Flow metrics, sometimes called value stream metrics, extend measurement beyond the development team to cover the entire journey from an idea’s approval to its delivery in front of a customer. Because flow metrics capture the queueing and approval delays that happen before a developer even opens a ticket, they often explain bottlenecks that cycle time and velocity alone cannot see.
Steps for Measuring Agile Performance
Dozens of agile metrics exist, and no team needs to track all of them at once. Choosing the right combination starts with a deliberate rollout rather than bolting metrics onto an existing process and hoping they stick. The steps below outline a practical path for introducing measurement without triggering the gaming that ruins a metrics program.
Consider these steps when measuring agile performance:
- Define Roles and Organizational Structures: Establish clear ownership over who collects, reviews, and acts on each metric so accountability does not get lost between teams.
- Focus on Customer: Anchor every metric to a real customer or business need instead of tracking numbers simply because a dashboard makes them available.
- Adapt Agile Practices: Establish a consistent cadence of Scrum or Kanban ceremonies so metrics get reviewed on schedule rather than sporadically.
- Adoption Maturity: Assess how mature the team’s agile practices already are, since immature teams need simpler metrics before layering on frameworks like DORA or SPACE.
- Dependency Improvements: Secure buy-in from both leadership and frontline team members so metrics are trusted rather than resented as surveillance.
Agile Performance vs Traditional Measurements
Agile measurement and traditional performance measurement start from different assumptions about time, ownership, and what actually counts as done. Agile teams review progress every sprint, typically one to four weeks, while traditional programs often wait for quarterly or annual checkpoints to assess how things are going. That shorter feedback loop lets agile teams course-correct quickly.
Agile measurement is also built around the whole team rather than the individual, reflecting the methodology’s emphasis on shared ownership and close collaboration. Traditional performance management, by contrast, typically evaluates individual contributors against personal goals and deadlines set months in advance, with feedback arriving far less often than the built-in rhythm of a sprint retrospective.
Common Mistakes When Measuring Agile Performance
Even a well-designed measurement program can backfire when the underlying behavioral incentives are ignored. Goodhart’s Law, the idea that a measure stops being useful once it becomes a target, explains most of the common failures below. Recognizing these patterns early helps teams keep their metrics honest rather than watching them quietly get gamed over time.
Watch for these recurring mistakes when rolling out agile metrics:
- Tying Velocity to Reviews: Once velocity affects a performance conversation, teams inflate estimates or split trivial work into extra tickets to look busier.
- Publishing Individual Leaderboards: Ranking individual contributors on commits or story points erodes trust faster than almost any other measurement decision a team can make.
- Reducing Performance to One Number: No single metric summarizes a team’s health, and leaders who ask for one dashboard number are usually asking the wrong question.
- Ignoring AI’s Effect on Activity Metrics: AI coding assistants can inflate commit counts and lines of code without a matching increase in real business value delivered.
- Skipping Qualitative Context: Numbers without a satisfaction survey or retrospective discussion miss half of what is actually happening on the ground.
Key Benefits of Measuring Your Agile Performance
Agile performance management is grounded in three core principles that shape how teams and leaders use the resulting data day to day. Applied consistently, this approach has been shown to improve both the employee experience and overall business outcomes, largely because it ties day-to-day performance data directly to the goals the organization actually cares about.
Agile performance management ultimately rests on three connected principles listed below:
- Transparency: Metrics and progress are visible to the whole team rather than hidden in a manager’s private notes.
- Collaboration: Measurement is a shared responsibility, encouraging the team to solve problems together instead of assigning blame.
- Flexibility: Metrics and goals adjust as circumstances change, rather than locking teams into targets set months earlier.
Organizations that adopt this approach consistently report a similar set of gains:
- Improved Communication: Regular metric reviews give teams a shared vocabulary for discussing progress and blockers.
- Increased Engagement: Employees who see how their work connects to measurable outcomes tend to stay more invested in the result.
- Better Performance: Faster feedback loops let teams correct course before small issues become larger delivery problems.
In practice, agile performance management helps businesses achieve several concrete results:
- Improve Employee Productivity: Clear, shared metrics reduce the ambiguity that often slows teams down mid-sprint.
- Drive Business Results: Tying metrics to customer and business outcomes keeps teams focused on value rather than activity.
- Facilitate Better Communication: Regular retrospectives give managers and employees a structured space to discuss what the data shows.
- Identify Areas of Improvement: Consistent measurement surfaces recurring bottlenecks before they become chronic problems.
Tools and Platforms for Tracking Agile Metrics
Most teams do not need custom tooling to start measuring agile performance, since the platforms teams already use for sprint planning typically expose the data automatically. Choosing the right agile software depends less on features and more on where the team’s work already lives, since fragmented data sources tend to undermine trust in the numbers faster than any single flawed metric.
Several platforms handle agile metric tracking well for different team sizes:
- Jira Software: Built-in burndown, velocity, and cumulative flow reports make it a common default for scrum and kanban teams already using it for planning.
- Azure DevOps: Offers native sprint and flow analytics for teams already working inside the Microsoft development ecosystem.
- GitLab Value Streams Dashboard: Surfaces DORA metrics directly from pipeline data, which suits teams that already manage code and CI/CD in GitLab.
- Dedicated Flow Analytics Platforms: Purpose-built tools aggregate DORA and flow data across multiple systems for organizations running several delivery pipelines at once.
- Spreadsheets and BI Dashboards: A practical starting point for smaller teams not yet ready to commit to a dedicated analytics platform.
Video Explaining Powerful Agile Metrics That Matter
Not sure which agile metrics actually move the needle? This video breaks down the most powerful metrics that high-performing teams use to track progress, improve delivery, and drive real business results — in just a few minutes.
Conclusion
Agile performance metrics only deliver value when a team chooses a small, balanced set and reviews it consistently rather than tracking everything available. Pairing delivery metrics like lead time and cycle time with quality signals such as defects per sprint, and newer frameworks like DORA and SPACE gives a fuller picture than any single number ever could on its own.
Traditional annual performance reviews cannot match the speed of feedback that sprint-based measurement provides, which is exactly why agile organizations continue to expand how they use it across departments and functions. Start with a few core metrics, revisit them each retrospective, and let the data guide honest conversations about how the team can keep improving together.
Frequently Asked Questions About Agile Performance Metrics
What is agile performance?
Agile performance refers to the set of metrics and practices used to evaluate how effectively a Scrum or Kanban team delivers value across sprints. It combines delivery speed, work quality, and team health rather than judging a team on a single number, and it typically gets reviewed at the end of every sprint rather than annually.
What are the most common metrics used to measure agile team performance?
Velocity, cycle time, lead time, and sprint burndown are among the most widely tracked metrics, since they give a quick read on delivery speed and consistency. Increasingly, teams also pair these with DORA metrics and SPACE survey data to capture stability and satisfaction alongside raw output.
What are the main differences between traditional performance measurement and agile performance measurement?
Agile teams review progress every sprint and focus on the team as a whole, while traditional performance management typically evaluates individual contributors against quarterly or annual goals. Agile teams also treat working software or a completed increment as the definition of done, rather than simply meeting a project deadline.
Why is measuring agile performance beneficial for an organization?
Measuring agile performance improves communication, increases engagement, and helps teams catch problems earlier because feedback arrives every sprint instead of once a year. It also ties day-to-day work directly to business outcomes, which makes it easier for leadership to see where investment is actually paying off.
How often should teams review their agile performance metrics?
Most teams review core delivery metrics like velocity and burndown at the end of every sprint during the retrospective, since that is when the data is freshest and most actionable. Broader indicators such as DORA metrics or release NPS are typically reviewed monthly or quarterly to spot longer-term trends.
Suggested articles:
- 16 Agile Project Metrics for Executives
- Agile Organizations: What They Are and How to Build One
- Agile Roles And Responsibilities Matrix Made Simple

Shane Drumm, holding certifications in PMP®, PMI-ACP®, CSM, and LPM, is the author behind numerous articles featured here. Hailing from County Cork, Ireland, his expertise lies in implementing Agile methodologies with geographically dispersed teams for software development projects. In his leisure, he dedicates time to web development and Ironman triathlon training. Find out more about Shane on shanedrumm.com and please reach out and connect with Shane on LinkedIn.