A value stream map visualizes every step required to transform a request into a finished product or service. It traces a product’s complete path of production, starting with the supplier and ending with the customer, capturing both material flow and the information that drives it. When teams can see the entire delivery process on a single page, the conversation about where to improve it becomes far more focused and productive.
This guide covers everything you need to get started with VSM: free downloadable templates for Word, Excel, and PowerPoint, a breakdown of the three core map segments, the four implementation stages, online tools currently used by lean practitioners, and the most common mistakes teams make when mapping for the first time.
VSM vs. Process Map
Value stream mapping and process mapping are often confused, but they serve different purposes and answer different questions. A value stream map provides an end-to-end view of how organizational value is delivered, spanning suppliers, internal processes, and the customer. It is designed to expose waste and bottlenecks across the full delivery chain, not just within a single department. This broader scope makes it the preferred tool for strategic process improvement.
A process map, by contrast, is typically used by engineering or operations teams to document and optimize the detailed steps within a specific workflow. Process mapping offers granular insights into individual processes rather than the holistic flow of value. Understanding which tool fits the situation helps teams avoid overengineering their analysis or missing systemic issues that fall outside a narrower diagram’s scope.
Segments of a Value Stream Map
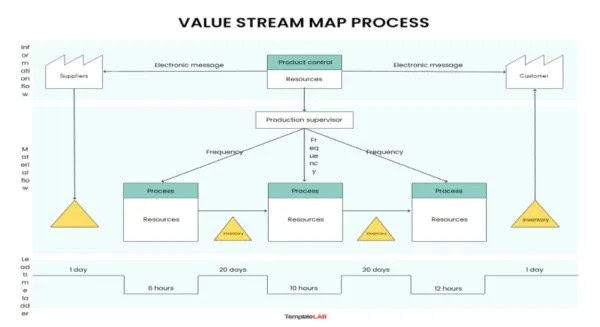
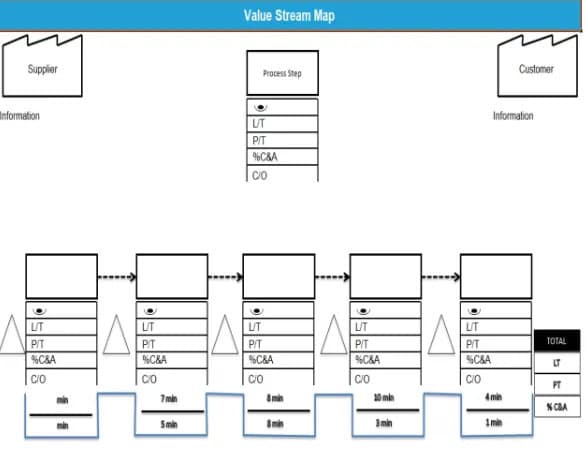
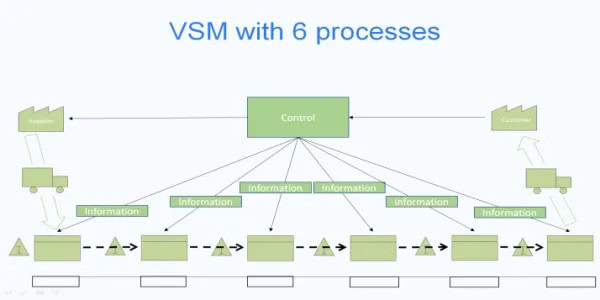
A well-constructed value stream map is organized into three distinct segments, each capturing a different layer of how work moves through a system. Together, these segments give cross-functional teams a complete picture of the delivery process, including where delays, handoffs, and communication breakdowns tend to occur. Familiarity with each segment is essential before attempting to map or improve any value stream.
Here is a breakdown of each VSM segment and what it communicates:
- Process or Production Flow: This segment runs from left to right across the map and captures every major step in the production sequence, including parallel tasks and subtasks. Drawing the flow horizontally makes it straightforward to identify which tasks occur most frequently and where the critical path lies. Teams use this segment to pinpoint bottlenecks and redundant steps that slow overall throughput.
- Communication or Information Flow: This segment shows how information moves through the value stream, triggering action at each stage. Unlike material flow, information does not follow a fixed direction and may move upstream, downstream, or laterally depending on the process. Capturing this flow is important because information delays are often the root cause of production slowdowns that appear to be operational problems.
- Travel Distances and Timelines: The timeline runs along the bottom of the map and separates processing time from waiting or queue time at each step. It quantifies the total lead time through the system and visually highlights where most time is lost between steps rather than inside them. Many teams find this segment the most actionable part of the map because it makes the cost of delays concrete and measurable.
Watch this step-by-step video guide on value stream mapping to see how the process works in practice. From identifying waste to designing a future state, this visual walkthrough makes it easier to understand and apply VSM concepts in your own organization.
Value Stream Map Template Word
Download the free Word-format VSM template below to get started with a familiar, editable document environment. The Word template works well for teams creating documentation-first deliverables or presenting the map alongside narrative context within a written report.
Visual Stream Map Template – Word
Value Stream Map Template Excel
Excel-based VSM templates are popular among operations and manufacturing teams that want to integrate map data with performance metrics, cycle time calculations, or inventory tracking in the same workbook. Two template options are available below for different complexity levels.
Value Stream Map Template PowerPoint
PowerPoint templates are the best choice when the primary goal is presenting a value stream map to stakeholders, leadership, or cross-functional team members in a meeting context. They prioritize visual clarity and presentation flow over data density.
Value Stream Map Template – PowerPoint
Benefits of Value Stream Map
A value stream map is one of the most effective tools available for evaluating end-to-end work processes. Its value comes not just from what it reveals, but from the shared understanding it creates across teams who previously only saw their own portion of the workflow. Organizations of all sizes, across manufacturing, software development, healthcare, and services, regularly apply VSM to drive meaningful efficiency gains.
The following benefits explain why VSM remains a foundational lean tool for process improvement teams:
- Customer Perspective Visibility: VSM forces teams to evaluate the delivery process through the lens of what the customer actually values, rather than what internal functions find convenient to measure. This shift in perspective often reveals that a significant portion of total lead time consists of steps the customer neither needs nor pays for, which creates a strong case for prioritization and elimination.
- Shared Process Language: The standardized notation of a value stream map gives cross-functional teams a common language for discussing, analyzing, and improving the delivery system. When everyone from operations to IT to finance can read the same map, alignment on improvement priorities becomes easier and faster.
- Waste and Inefficiency Detection: By separating value-added steps from non-value-added ones, a VSM makes waste visible in a way that verbal descriptions or isolated metrics cannot. Teams can see exactly where inventory accumulates, where handoffs stall, and which steps consume time without advancing the product toward the customer.
- Workforce Process Understanding: Walking the value stream as part of the mapping exercise gives team members at all levels a broader view of how their individual work connects to the overall system. This systemic awareness reduces siloed thinking and encourages employees to consider upstream and downstream implications of their decisions.
- Production Workflow Improvement: The completed current-state map, combined with a future-state design, provides a concrete blueprint for targeted workflow changes. Rather than general improvement initiatives, teams can implement specific, sequenced changes tied to identified waste in the map.
Value Stream Map Online Tools
Digital VSM tools have largely replaced pen-and-paper mapping for teams that need real-time collaboration, version control, or integration with broader workflow management platforms. The following tools are widely used by lean practitioners in 2025 and offer purpose-built features for value stream mapping.
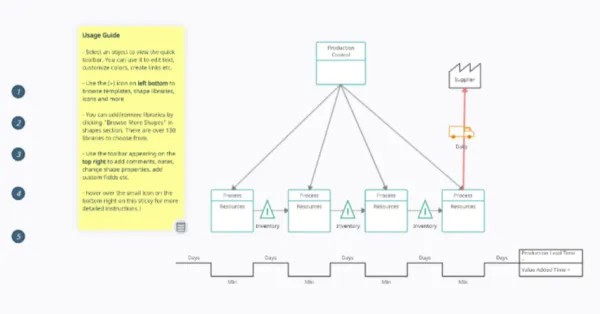
1. Creately
Creately offers a dedicated value stream mapping workspace with built-in VSM shapes, real-time collaboration, and cloud-based storage. Teams can visualize process steps, quantify cycle times, and update maps as workflows evolve without leaving the editor. It also supports notes panels and embedded links, which makes it useful for attaching data or process documentation directly to map elements.
2. Lucidchart
Lucidchart’s VSM template supports both material flow and information flow mapping with drag-and-drop functionality and a presentation mode for sharing with stakeholders. Its collaborative features allow multiple users to edit the same map simultaneously, which is particularly useful for cross-functional mapping sessions. Lucidchart also offers a free plan with basic features for teams exploring VSM for the first time.
3. Miro
Miro’s value stream mapping template sits within a broader digital whiteboard environment, making it well-suited for teams that combine VSM with retrospectives, planning workshops, or design sprints. It supports custom templates, sticky notes, and real-time collaboration across large distributed teams. Miro integrates with tools like Jira, Confluence, Slack, and Microsoft Teams, which simplifies connecting map insights to active project workflows.
Additional Tools Worth Considering
Beyond these three, several other platforms have gained traction among lean and DevOps teams in recent years. The following options offer specialized capabilities for specific industries or team sizes:
- eVSM: A purpose-built VSM software used by manufacturing enterprises for complex mixed-model value streams. It supports automated analytics for lead time, capacity, and inventory across plant production and supply network maps.
- Businessmap (formerly Kanbanize): Combines value stream management with Kanban-style workflows, offering real-time flow metrics and integration with common DevOps tools.
- ServiceNow: Includes value stream management features within its DevOps and Software Asset Management modules, making it popular with large enterprises already using the platform.
- Digital.ai: Provides enterprise-grade VSM with visibility and analytics across Agile, DevOps, and business processes, including end-to-end traceability for software delivery teams.
Value Stream Map Analysis and Best Practices
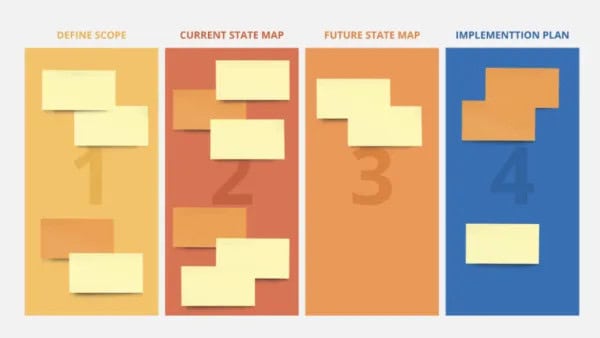
Executing a successful value stream mapping exercise requires more than drawing boxes and arrows. The quality of the insights depends directly on how the mapping process is structured, who is involved, and how the team transitions from observation to action. Industry practitioners consistently point to four stages that form the backbone of an effective VSM initiative.
1. Preparation
Preparation is the stage that most directly determines whether the mapping exercise produces actionable results or sits on a shelf. A cross-functional team is assembled during this phase, including representatives from each major step in the value stream and a facilitator or manager to coordinate the process. The team agrees on the scope of the map, the product family being analyzed, and the specific improvement objectives before any observation begins.
Getting scope right is especially important. Focusing too narrowly on one department will produce a map that misses systemic waste, while an overly broad scope can result in a map with so many process boxes that it becomes unreadable. Most lean practitioners recommend keeping the map between four and fifteen process steps for the initial exercise.
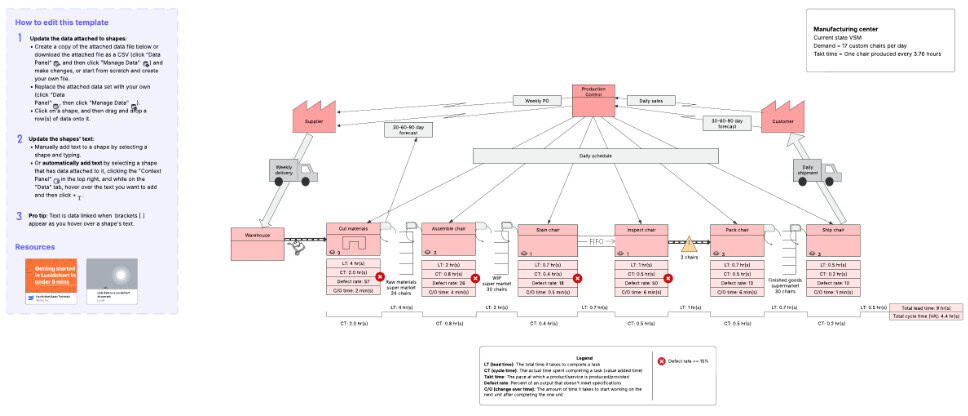
2. Current State Map
The current state map is built through direct observation of the value stream in action, not from memory or historical data. Teams walk the physical or digital process path, recording actual cycle times, wait times, inventory levels, and information triggers at each step. Relying on past data collected by someone else is one of the most common mistakes in this stage because it often fails to capture the real-time reality of the process.
Building the current state map accurately requires the full team to observe the process together rather than splitting responsibilities across departments. When observation is divided, no single team member develops a clear picture of the entire value stream, and the map ends up reflecting assumptions rather than facts.
3. Future State Map
The future state map is designed based on what the team identified as waste, delay, or inefficiency in the current state. It represents the target condition the organization is working toward, not a theoretical ideal, but a realistic, improved state that can be implemented in a defined time horizon. Common future state improvements include reducing batch sizes, eliminating unnecessary approval steps, introducing pull systems, or combining process steps that currently require separate handoffs.
A good future state map focuses on improving flow and reducing lead time rather than optimizing individual process steps in isolation. The goal is to make value move faster and more reliably through the system from the customer’s point of view.
4. Planning and Implementation
The final stage translates the future state map into a structured action plan with owners, timelines, and measurable targets. Breaking the future state into discrete kaizen bursts or improvement projects makes it easier to assign accountability and track progress. Without this step, the mapping exercise remains a documentation activity rather than a driver of change.
A common mistake at this stage is treating the map as a finished artifact rather than a living document. Value stream maps should be updated regularly to reflect process changes, because an outdated map can mislead teams and erode confidence in the tool.
Common VSM Mistakes to Avoid
Even experienced teams run into pitfalls when mapping value streams for the first time in a new environment. Being aware of these patterns before starting reduces the risk of investing significant effort in a map that produces limited improvement. The following are some of the value stream mapping mistakes that appear consistently across initiatives in manufacturing, software, and services:
- Overcomplicating the Map: Adding too much detail makes the map harder to read and analyze, which defeats its primary purpose as a communication tool. Keeping the number of process boxes between four and fifteen ensures the map remains clear enough to guide decision-making.
- Ignoring Information Flow: Teams often focus exclusively on the material or product flow while overlooking how information moves through the system. Both flows are essential for an accurate picture, and information delays are frequently the root cause of production stoppages.
- Using Stale Data: Building a map from historical records or secondhand observations produces a distorted view of the current state. Direct observation at the time of the mapping exercise is the only reliable way to capture what is actually happening.
- Skipping the Action Plan: A current state map without a future state design and an implementation roadmap is an incomplete exercise. The map is a means to improvement, not an end in itself.
- Treating VSM as a One-Time Project: A value stream map becomes obsolete as processes change. Organizations that treat VSM as an ongoing management practice rather than a one-time event consistently extract more value from the method over time.
Video Explaining What a Value Stream Map Is and How to Use It
Watch this step-by-step video guide on value stream mapping to see how the process works in practice. From identifying waste to designing a future state, this visual walkthrough makes it easier to understand and apply VSM concepts in your own organization.
Conclusion
Value stream mapping gives teams a structured, visual way to understand how work flows from supplier to customer, and where that flow breaks down. By working through the four implementation stages and applying the templates and tools covered in this guide, organizations can move from a fragmented view of their processes to a shared understanding that supports targeted, measurable improvement.
The real benefit of VSM compounds over time is when it becomes embedded in how teams operate, not just deployed as an occasional project. Whether you are starting with a free Word or Excel template or adopting a digital platform like Creately or Lucidchart, the most important step is getting the right people in the room, observing the actual process, and committing to act on what the map reveals.
Frequently Asked Questions About Value Stream Mapping
When should you use a value stream map?
VSM is most effective for processes with repeatable steps, multiple handoffs between teams or departments, or persistent lead time and quality issues. It is particularly well-suited for situations where the overall delivery time is significantly longer than the actual processing time, as the gap between those two numbers represents the waste the map is designed to expose and eliminate.
What are the main limitations of value stream mapping?
VSM can lose accuracy and usefulness when multiple products share no common material flow path, making it difficult to represent them on a single map. It also does not capture financial dimensions of a process, such as operating costs, profit margins, or inventory carrying expenses. For organizations with highly variable product mixes, VSM must be applied at the product family level to remain meaningful.
How does value stream mapping reduce lead time?
VSM reduces lead time by making the non-value-added steps in a process visible and measurable. The timeline segment at the bottom of the map separates time spent in processing from time spent waiting, giving teams a clear target for reduction. By systematically eliminating or compressing the waiting periods between steps, organizations can often cut total lead time by thirty to sixty percent without adding resources.
Is value stream mapping a continuous improvement tool?
Yes. The goal of VSM is not to produce a single optimized design but to support a cycle of observation, improvement, and re-mapping over time. Each iteration of a current-state map should reflect a process that is measurably better than the one that preceded it, and each future-state design sets the target for the next improvement cycle. Organizations that use VSM as a continuous practice rather than a standalone project see the most sustained gains in efficiency and quality.
What is the difference between a current state and a future state value stream map?
The current state map documents how the value stream actually operates today, based on direct observation of real cycle times, wait times, inventory levels, and information flows. The future state map represents the improved target condition the team is working toward, designed by identifying and eliminating the waste revealed in the current state. Both maps are necessary: the current state defines the baseline, and the future state provides the direction for improvement initiatives.
Suggested articles:
- 26+ Free Start Stop Continue Templates: Word, Excel, and PowerPoint
- 7 Free Release Plan Templates (Word, Excel, and PowerPoint)
- 21 Free Capacity Planning Templates (Word, Excel, and PowerPoint)
Shane Drumm, holding certifications in PMP®, PMI-ACP®, CSM, and LPM, is the author behind numerous articles featured here. Hailing from County Cork, Ireland, his expertise lies in implementing Agile methodologies with geographically dispersed teams for software development projects. In his leisure, he dedicates time to web development and Ironman triathlon training. Find out more about Shane on shanedrumm.com and please reach out and connect with Shane on LinkedIn.