Project scheduling is only as strong as your understanding of what actually drives completion. Two concepts sit at the center of that reality: the critical path and network sensitivity. Together, they determine not just when a project finishes, but how stable—or fragile—that timeline becomes when real-world pressure, delays, and shifting priorities inevitably begin to affect execution across multiple dependent tasks.
In modern environments using Microsoft Project, these concepts remain fundamental to maintaining control over delivery timelines. Project Desktop is where the real calculations happen, including dependencies, slack values, and critical path logic. Microsoft Planner builds on that foundation by making those insights visible to the wider team, ensuring execution aligns with the actual schedule.
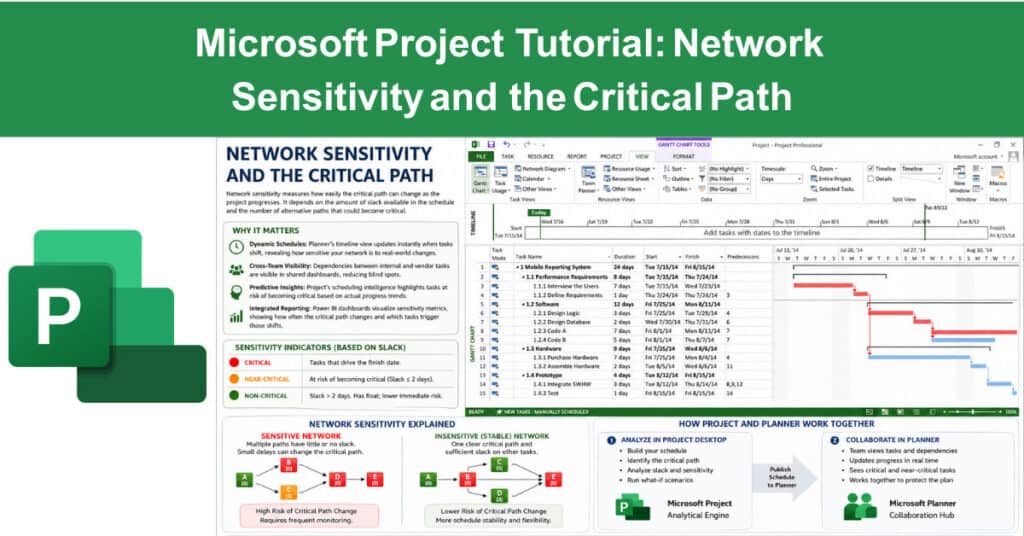
Understanding Network Sensitivity in Project Scheduling
Network sensitivity measures how easily the critical path can shift during execution as tasks progress and conditions change. A schedule is considered sensitive when multiple task paths are close to becoming critical, usually due to low slack values. In this situation, even small delays can quickly redefine which sequence of tasks ultimately controls the project’s completion date.
An insensitive network, by contrast, has one dominant critical path supported by sufficient float in other tasks to absorb disruption. This creates a more stable execution environment. The practical takeaway is straightforward: sensitivity tells you whether your schedule can handle pressure or whether even minor slippage will immediately cascade into broader delays and missed delivery expectations.
Why Network Sensitivity Matters
Most projects don’t fail because of one major breakdown—they fail because small, overlooked delays accumulate across tasks that were never closely monitored. Sensitivity analysis exists to expose those weak points early, before they quietly grow into critical issues that directly impact the project timeline and reduce the ability to recover without significant disruption or rework.
In modern workflows, this is no longer just theoretical analysis done once at the planning stage. With Microsoft Project performing calculations and Microsoft Planner extending visibility, sensitivity becomes something you actively manage throughout execution rather than something you review after problems have already occurred.
Here’s why sensitivity analysis is more valuable than ever:
- Dynamic Schedules: Planner’s timeline updates instantly when tasks shift, revealing how sensitive your network is to real-world changes.
- Cross-Team Visibility: Dependencies between internal teams and external vendors are visible in shared views, reducing blind spots.
- Predictive Insights: Project’s scheduling intelligence highlights tasks trending toward critical status based on actual progress.
- Integrated Reporting: Power BI dashboards visualize sensitivity trends, showing how often the critical path shifts and what causes it.
Critical Path Basics Refresher
The critical path is the longest sequence of dependent tasks that determines the shortest possible duration required to complete a project. If any task on this path is delayed, the entire project is delayed as well. There is no built-in flexibility within this sequence, which is why identifying and monitoring it correctly is essential for maintaining control.
Understanding the supporting concepts behind the critical path is just as important as identifying it. Without a clear grasp of how duration, dependencies, and slack interact, the schedule becomes difficult to manage effectively. These elements form the structure that allows project managers to interpret risk, adjust timelines, and maintain alignment between planning and actual execution.
Key concepts:
- Duration: The total time required to complete a task, forming the foundation of schedule calculations.
- Dependencies: Logical relationships between tasks, such as Finish-to-Start or Start-to-Start, which define execution order.
- Slack (Float): The amount of time a task can be delayed without affecting the project’s completion date.
- Critical Tasks: Tasks with zero slack that directly control the finish date and require constant monitoring.
In Microsoft Project Desktop, critical tasks are clearly highlighted in the Gantt chart, allowing project managers to focus immediately on the sequence that determines the final delivery date without needing to manually calculate or interpret complex scheduling relationships.
How to View the Critical Path in Microsoft Project Desktop
Microsoft Project Desktop is the most reliable tool for critical path analysis, calculating task relationships, durations, and slack with precision. However, that accuracy depends entirely on how well your schedule is structured. Poorly defined durations, missing dependencies, or incorrect sequencing will cause Microsoft Project to miscalculate the critical path entirely—and trust me, cleaning that up later costs far more time than getting it right from the start.
Before doing anything else, verify one critical setting. Go to File → Options → Advanced, scroll to the bottom, and confirm that “Tasks are critical if slack is less than or equal to” is set to zero. This ensures the software correctly identifies which tasks have no wiggle room.
Two rules that will save you hours:
- Every task in your schedule should have at least one successor, except the very last task. This ensures all dependencies chain together correctly.
- Never link predecessors or successors to summary-level tasks. Always connect dependencies at the individual task level. Ignoring this is one of the most common reasons the critical path calculates incorrectly.
Step-by-step process:
- Set Up Your Schedule Properly: Enter all tasks with accurate durations, define dependencies at the task level, and assign resources where necessary.
- Switch to Gantt Chart View: Right-click the left panel and select Gantt Chart, then right-click the top-left box icon and choose Entry.
- Highlight the Critical Path: Go to the Gantt Chart Format tab and check Critical Tasks under Bar Styles. Critical tasks will immediately appear in red on the Gantt chart.
- Analyze Slack Values: Switch to Schedule View (right-click the top-left box and select Schedule) to see Total Float values for every task. Tasks with zero total float are on your critical path.
- Filter to Critical Tasks Only: Go to View → Filter → Critical to display only critical path tasks in both the table and Gantt chart. To hide summary tasks from this view, go to Gantt Chart Format → Show/Hide and uncheck Summary Tasks.
- Color-Code Critical Tasks in the Table: Go to Gantt Chart Format → Text Styles, select Critical Tasks from the dropdown, and change the text color to dark red. This makes critical tasks instantly visible when reviewing multiple projects.
- Add a Critical Column: Click Add New Column, scroll down, and select Critical. Each task will now display a clear Yes or No, confirming whether it sits on the critical path.
Remember that the critical path is dynamic. If a non-critical task consumes all of its available float, for example, a task with six days of slack that ends up taking significantly longer, it will automatically shift onto the critical path, potentially pushing back your project’s finish date. Microsoft Project recalculates this in real time whenever task durations are updated, so monitoring float on near-critical tasks is just as important as watching the critical path itself.
For more tutorials on using Microsoft Project, check out this course about Microsoft Project BEGINNER to EXPERT.
Extending Visibility with Microsoft Planner
Once the schedule is built and the critical path is clearly defined, Planner becomes the execution layer that brings visibility to the broader team. Instead of keeping scheduling logic confined to Project Desktop, publishing the schedule allows team members to engage with tasks in a more accessible and interactive format.
Planner does not replace the analytical capabilities of Project. Instead, it extends them by making task relationships, priorities, and progress visible in real time. This ensures that everyone involved understands how their work connects to the overall schedule, improving project coordination and reducing delays caused by miscommunication or lack of visibility.
What this enables:
- Shared Visibility: Teams can see task sequences, dependencies, and priorities without needing access to Project Desktop.
- Real-Time Progress Tracking: Updates happen live, reducing delays between execution and reporting.
- Simplified Task Management: Boards and timelines make complex schedules easier to understand and follow.
- Better Accountability: Clear ownership and visibility improve follow-through across the team.
By extending scheduling insights into a collaborative environment, Planner ensures that the critical path is not just identified but actively managed by the entire team throughout the project lifecycle.
Example: Sensitive vs. Stable Scheduling
Consider a project where several task paths have little to no slack, meaning multiple sequences could become critical at any moment. In this case, even a minor delay in a non-critical task can shift the critical path, creating instability. This type of schedule requires constant monitoring and rapid response to prevent delays from spreading.
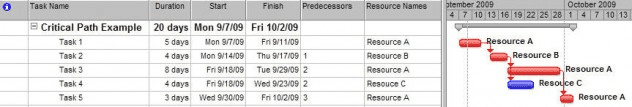
Imagine a simple five‑task project:
| Task | Duration | Dependency | Slack | Critical? |
|---|---|---|---|---|
| 1 – Requirements | 3 days | Start | 0 | ✅ |
| 2 – Design | 4 days | 1 FS | 0 | ✅ |
| 3 – Development | 5 days | 2 FS | 0 | ✅ |
| 4 – Testing | 3 days | 3 FS | 2 | ❌ |
| 5 – Deployment | 2 days | 3 FS | 0 | ✅ |
- Here, Tasks 1‑3‑5 form the critical path. Task 4 has slack, so delays there won’t affect the finish date. This is an insensitive network.
- If Task 4’s slack drops to zero due to resource constraints or overlapping dependencies, the project now has two critical paths—making it sensitive. In Planner, both paths would appear in red, alerting the team to potential schedule volatility.
Now compare that to a project with one clearly defined critical path and sufficient float across other tasks. In this scenario, delays in non-critical activities do not immediately impact the overall timeline. This creates a more stable environment, allowing project managers to prioritize effectively without reacting to every small disruption.
Advanced Techniques for Managing Sensitivity
Basic critical path analysis provides a strong foundation, but it is not enough for managing complex or high-risk projects. Additional techniques are required to monitor changes, test scenarios, and maintain control over schedules as conditions evolve throughout execution.
These advanced methods allow project managers to move beyond static planning and into continuous optimization. By combining baseline tracking, scenario testing, and data visualization, it becomes possible to anticipate issues before they impact delivery and adjust strategies accordingly without disrupting the overall plan.
Key techniques:
- Baselines and Variance Tracking: Set a baseline schedule and compare it to actual progress to detect shifts in timing and sensitivity.
- Scenario Simulation: Test alternative approaches without changing the live plan, allowing you to evaluate decisions before committing.
- Resource Analysis: Identify over-allocated resources that could create bottlenecks and introduce new critical paths.
- Power BI Integration: Use dashboards to track schedule trends and identify recurring patterns that signal risk.
Best Practices for Critical Path Management
Effective critical path management depends on consistency, discipline, and attention to detail rather than relying solely on tools. Even the most advanced scheduling software cannot compensate for poorly structured tasks or inaccurate dependencies, which is why strong foundational practices are essential.
By applying consistent standards and regularly reviewing the schedule, project managers can maintain control over both the critical path and overall sensitivity. This ensures that the schedule remains accurate, actionable, and aligned with real-world execution rather than becoming outdated or disconnected from actual progress.
What actually works:
- Standardize Task Definition: Every task must have a clear duration, dependency, and owner—no exceptions.
- Monitor Near-Critical Tasks: Tasks with low slack are often the ones that quietly become critical.
- Keep Dependencies Accurate: Incorrect relationships break schedules faster than anything else.
- Use Planner for Team Alignment: Give teams a live view of work instead of relying on static reports.
- Review the Schedule Regularly: Treat the schedule as a living system that needs constant validation.
Conclusion
Critical path and network sensitivity analysis are not optional; they are the backbone of effective project scheduling. Without them, timelines become unreliable, risk goes undetected, and project execution quickly turns reactive instead of controlled, making it difficult to deliver consistently on time. Understanding where sensitivity exists in your schedule allows you to focus attention where it matters most and act before small delays become critical failures.
Microsoft Project remains the analytical engine where scheduling decisions are made, providing the structure, logic, and visibility needed to manage complexity with confidence. Microsoft Planner ensures those decisions are visible and actionable across the entire team, keeping everyone aligned on priorities and progress. Together, they create a powerful system where planning, execution, and risk management stay connected and aligned from start to finish.
Suggested articles:
- The Pros and Cons of Using MS Project Software
- Microsoft Project Tutorial: Import Excel Into Microsoft Project (Planner)
- Microsoft Project Pricing Plans & Costs Guide
Andrew Makar, DMIT, PMP, CSM is an IT director with delivery experience across projects, programs and portfolios in Digital Marketing, Automotive, Software and Financial Management industries. He is an enthusiastic leader who effectively translates project management theory into practical application. His area of interest and practice is in implementing Agile processes and SCRUM techniques to deliver better software to his customers. Find out more about Andrew on andymakar.com and please reach out and connect with Andrew on LinkedIn.